Azure Databricks OCF Connector: Install and Configure
Alation Cloud Service Applies to Alation Cloud Service instances of Alation
Customer Managed Applies to customer-managed instances of Alation
Network Connectivity
Open outbound TCP port 443 to the Azure Databricks server.
Service Account
In Azure Databricks, create a service account for Alation. Refer to Manage users - Azure Databricks.
Permissions for Metadata Extraction and Profiling
The service account must have the following permissions to perform MDE and profiling:
Can Attach permission to connect to the cluster. Refer to Permission Requirements in Microsoft documentation for more details.
Optionally, Can Restart permission to automatically trigger the cluster to start if its state is terminated while connecting.
Workspace access—Refer to Manage users.
Cluster-level access—Refer to Cluster access control.
By default, all cluster users have access to all data stored in a cluster’s managed tables unless table access control is enabled for that cluster. The table access control option is only available for high-concurrency clusters. Refer to Table Access Control for more information.
If the Table Access Control option is enabled on the cluster:
Grant the SELECT privilege on all schemas and all their tables and views in a catalog.
GRANT USAGE ON CATALOG <catalog-name> TO `<user>@<domain-name>`;
GRANT SELECT ON CATALOG <catalog-name> TO `<user>@<domain-name>`;
Grant the SELECT privilege on a specific schema and all its tables and views.
GRANT USAGE ON SCHEMA <schema-name> TO `<user>@<domain-name>`;
GRANT SELECT ON SCHEMA <schema-name> TO `<user>@<domain-name>`;
Grant the SELECT privilege on specific tables and views in a schema.
GRANT USAGE ON SCHEMA <schema-name> TO `<user>@<domain-name>`;
GRANT SELECT ON TABLE <schema-name>.<table-name> TO `<user>@<domain-name>`;
GRANT SELECT ON VIEW <schema-name>.<view-name> TO `<user>@<domain-name>`;
Refer to Data object privileges for more information.
Authentication
The connector supports token-based authentication. Follow the steps in Databricks documentation to generate a personal access token for the service account and save it in a secure location:
You will use the personal access token as password when configuring your data source connection from Alation.
JDBC URI
The JDBC URI string you provide in Alation depends on the connector version:
Newer versions 2.0.0 and later use the Databricks JDBC driver.
Older versions below version 2.0.0 use the JDBC Spark driver.
If you are using a Databricks cluster, get the JDBC URI as documented in Azure Databricks: Get connection details for a cluster.
If you are using a Databricks SQL warehouse (SQL endpoints), get the JDBC URI as documented in Azure Databricks: Get connection details for a SQL warehouse.
If you are not using hive_metastore as the default connection catalog, include the ConnCatalog and ConnSchema properties in the JDBC URI. Example ConnCatalog=en_dlake_cat;ConnSchema=data_governance;.
When specifying the JDBC URI in Alation, remove the jdbc: prefix.
Note
The property
UseNativeQuery=0is required for custom query-based sampling and profiling. Without this property in the JDBC URI, custom query-based sampling or profiling will fail. If you are not using custom query-based sampling and profiling in your implementation of this data source type, you can omit this property from the JDBC URI string.Find more information in ANSI SQL-92 query support in JDBC in Azure Databricks documentation.
Connection String for Databricks JDBC Driver
Find more information in Databricks JDBC driver in Azure Databricks documentation.
Format
databricks://<hostname>:443/default;transportMode=http;ssl=1;httpPath=<databricks_http_path_prefix>/<databricks_cluster_id>;AuthMech=3;UseNativeQuery=0
Example
databricks://adb-900784758547414.14.azuredatabricks.net:443/default;transportMode=http;ssl=1;httpPath=sql/protocolv1/o/900734538547414/1012-1275722-nju5lmv8;AuthMech=3;UseNativeQuery=0
Connection String for Spark JDBC Driver
Find more information in JDBC Spark driver in Databricks documentation.
Format
spark://<hostname>:443/default;transportMode=http;ssl=1;httpPath=<HTTP_Path>;AuthMech=3;UseNativeQuery=0
Example
spark://adb-900784758547414.14.azuredatabricks.net:443/default;transportMode=http;ssl=1;httpPath=sql/protocolv1/o/900734538547414/1012-1275722-nju5lmv8;AuthMech=3;UseNativeQuery=0
Configuration of Query Log Ingestion
Query log ingestion (QLI) requires configuration in both Databricks and Alation. See Azure Databricks OCF Connector: Query Log Ingestion on how to configure QLI.
Connector Installation and Creating a Data Source
STEP 1: Install the Connector
Alation On-Premise
Important
Installation of OCF connectors requires Alation Connector Manager to be installed as a prerequisite.
To install an OCF connector:
If this has not been done on your instance, install the Alation Connector Manager: Install Alation Connector Manager.
Ensure that the OCF connector Zip file is available on your local machine.
Install the connector on the Connectors Dashboard page using the steps in Manage Connectors.
Alation Cloud Service
Note
On Alation Cloud Service instances, Alation Connector Manager is available by default.
Depending on your network configuration, you may need to use Alation Agent to connect to databases.
Connection via Alation Agent
Ensure that Alation Agent is enabled on your Alation instance. If necessary, create a Support ticket with Alation for an Alation representative to enable the Alation Agent feature on your instance and to receive the Alation Agent installer.
Connection Without Agent
To install an OCF connector:
Ensure that the OCF connector Zip file is available on your local machine.
Install the connector on the Connectors Dashboard page using the steps in Manage Connectors.
STEP 2: Create and Configure a New Data Source
In Alation, add a new data source:
Log in to Alation as a Server Admin.
Expand the Apps menu on the right of the main toolbar and select Sources.
On the Sources page, click +Add on the top right of the page and in the list that opens, click Data Source. This will open the Add a Data Source wizard.
On the first screen of the wizard, specify a name for your data source, assign additional Data Source Admins, if necessary, and click the Continue Setup button on the bottom. The Add a Data Source screen will open.
On the Add a Data Source screen, the only field you should populate is Database Type. From the Database Type dropdown, select the connector name. After that you will be navigated to the Settings page of your new data source.
Note
Agent-based connectors will have the Agent name appended to the connector name.
The name of this connector is Azure Databricks OCF Connector.
Next, configure the settings of your data source:
Access
On the Access tab, set the data source visibility using these options:
Public Data Source—The data source will be visible to all users of the catalog.
Private Data Source—The data source will be visible to the users allowed access to the data source by Data Source Admins.
You can add new Data Source Admin users in the Data Source Admins section.
General Settings
Note
This section describes configuring settings for credentials and connection information stored in the Alation database. If your organization has configured Azure KeyVault or AWS Secrets Manager to hold such information, the user interface for the General Settings page will change to include the following icons to the right of most options:

By default, the database icon is selected, as shown. In the vault case, instead of the actual credential information, you enter the ID of the secret. See Configure Secrets for OCF Connector Settings for details.
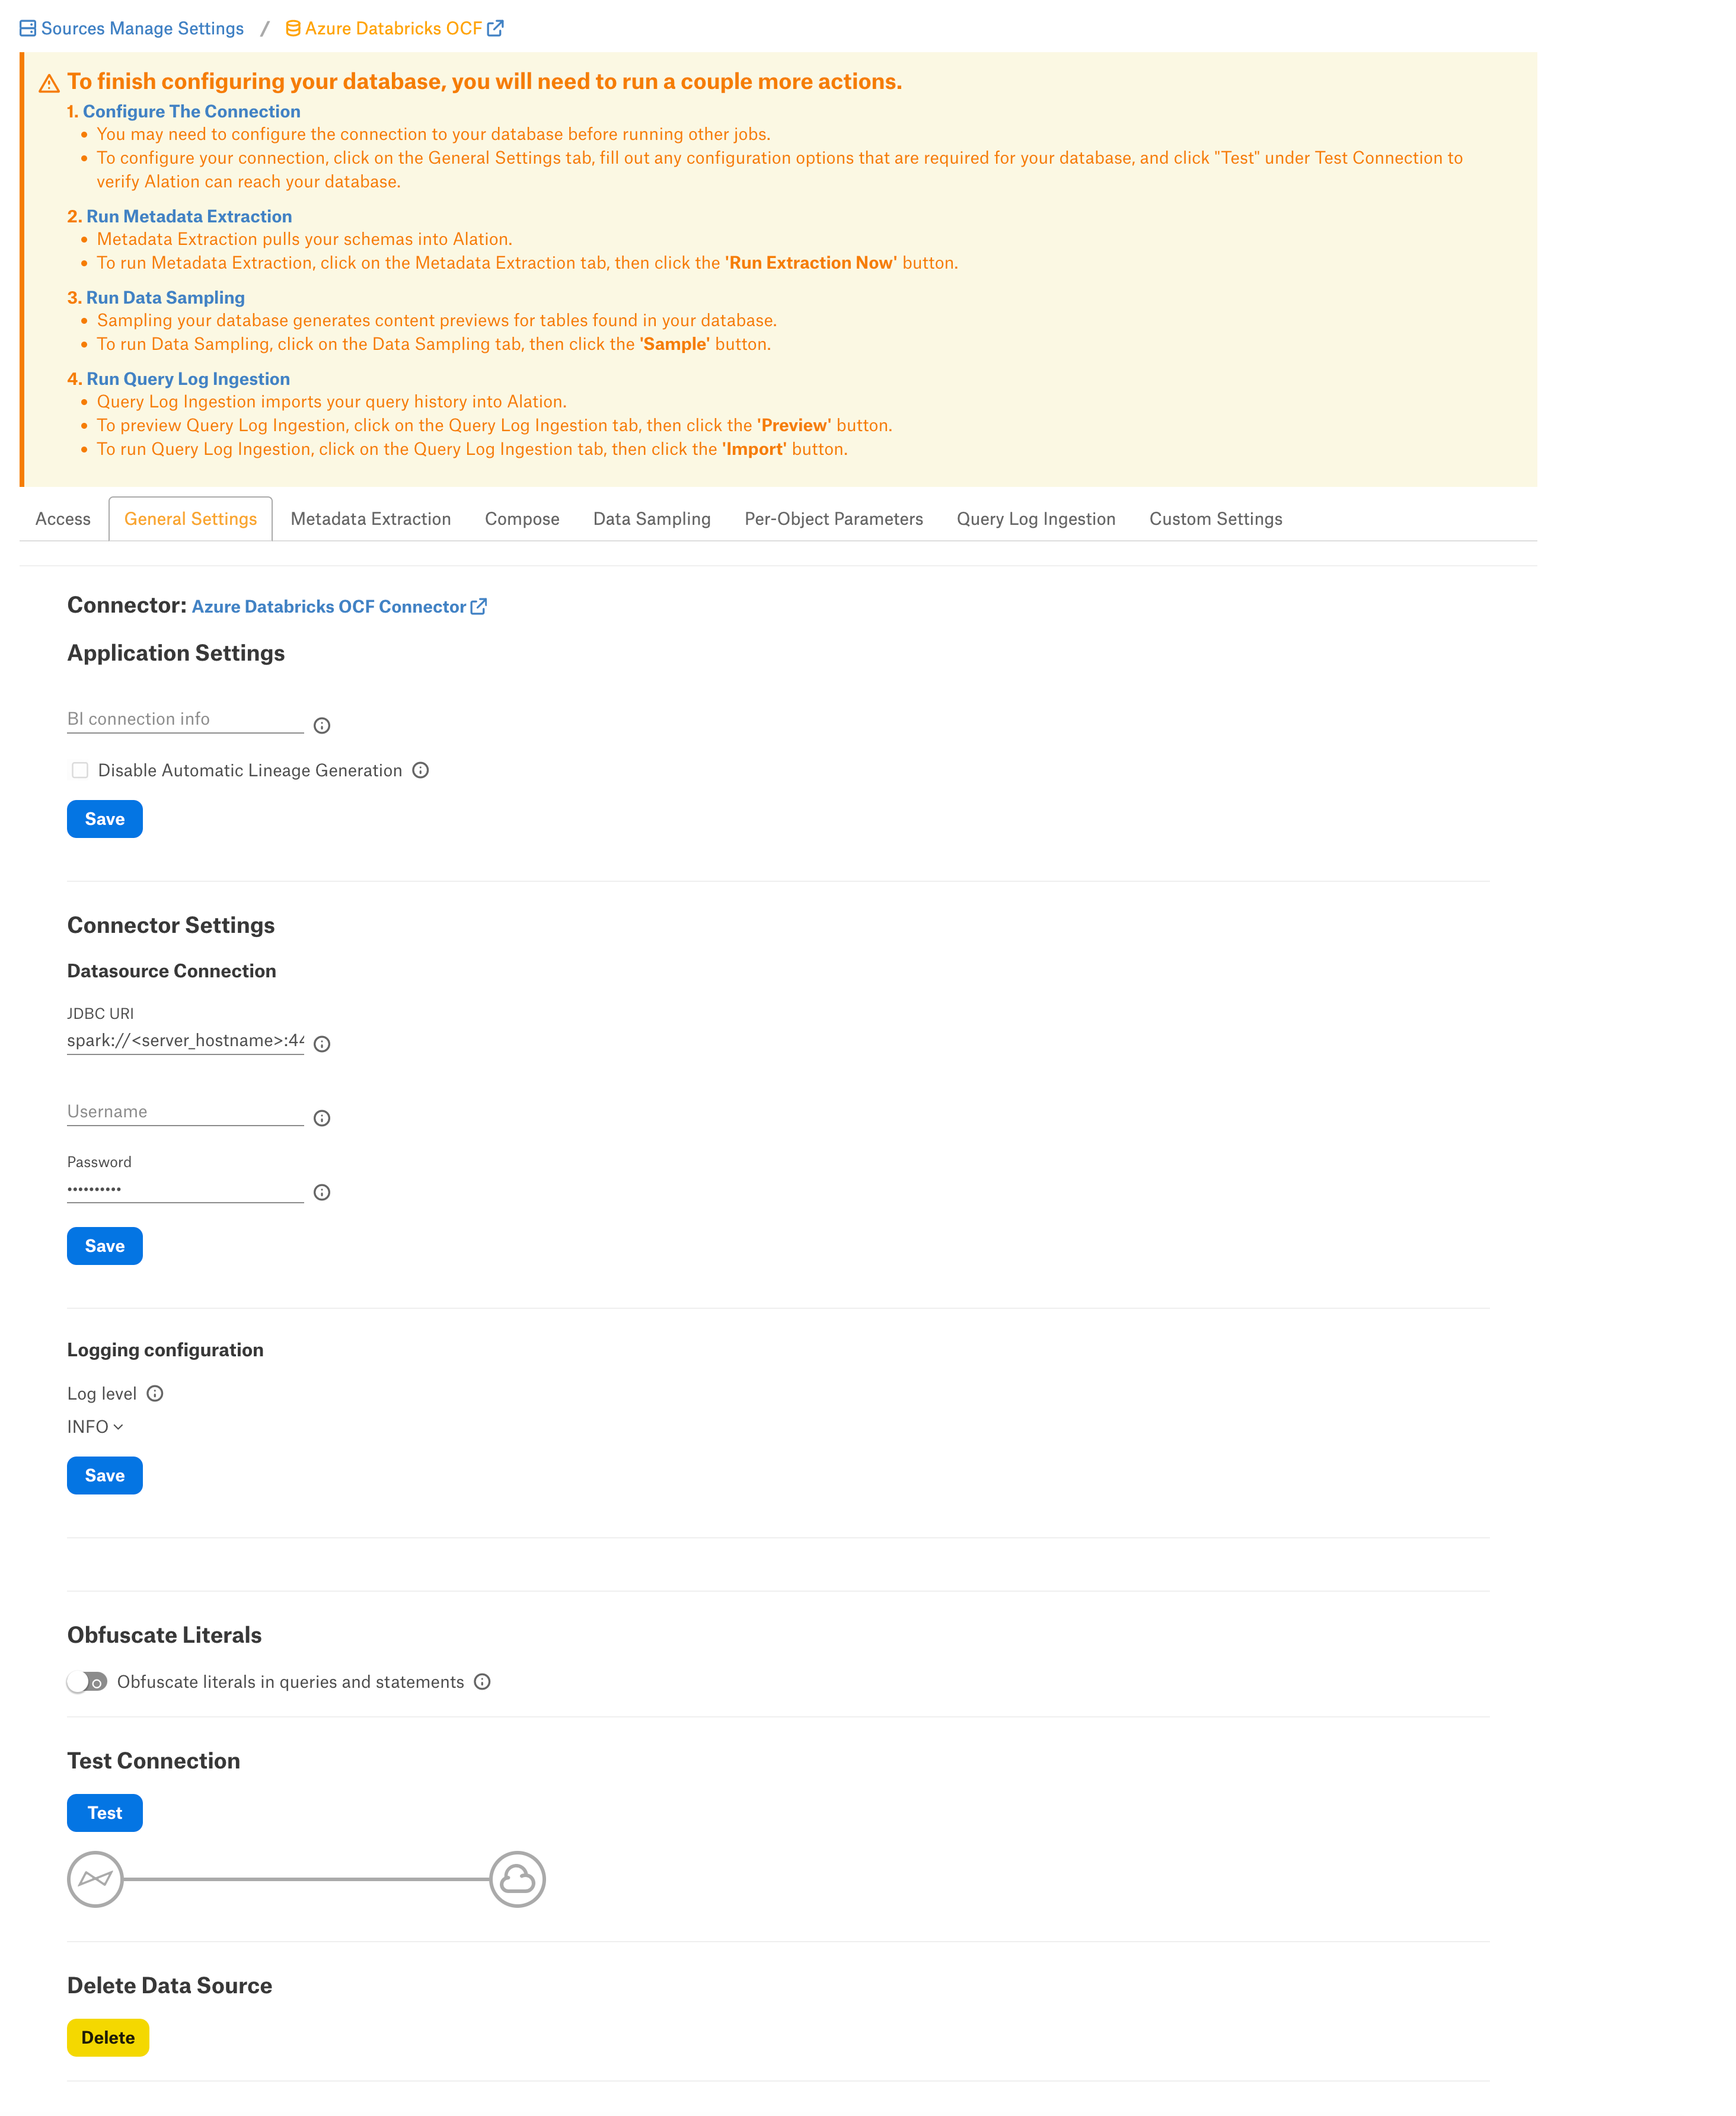
Perform the configuration on the General Settings tab:
Application Settings
Specify Application Settings if applicable. Click Save to save the changes after providing the information.
Parameter |
Description |
|---|---|
BI Connection Info |
This parameter is used to generate lineage between the current data source and another source in the catalog, for example a BI source that retrieves data from the underlying database. The parameter accepts host and port information of the corresponding BI data source connection. Use the following format: You can provide multiple values as a comma-separated list:
Find more details in BI Connection Info. |
Disable Automatic Lineage Generation |
Select this checkbox to disable automatic lineage generation from QLI, MDE, and Compose queries. By default, automatic lineage generation is enabled. |
Connector Settings
Data Source Connection
Populate the data source connection information and save the values by clicking Save in this section.
Parameter
Description
JDBC URI
Specify the JDBC URI in the required format.
Username
Use the value
token.Password
Paste the personal access token for the service account.
Logging Configuration
Select the logging level for the connector logs and save the values you provided by clicking Save in this section. The available log levels are based on the Log4j framework.
Parameter
Description
Log Level
Select the log level to generate logs. The available options are INFO, DEBUG, WARN, TRACE, ERROR, FATAL, ALL.
Obfuscate Literals
Obfuscate Literals—Enable this toggle to hide the details of the queries in the catalog page that are ingested via QLI or executed in Compose. This toggle is disabled by default.
Test Connection
Under Test Connection, click Test to validate network connectivity.
Add-On OCF Connector for dbt
The dbt connector can be used as an add-on with another OCF connector to extract and catalog descriptions and lineage from dbt models, sources, and columns in dbt Core or dbt Cloud. See Add-On OCF Connector for dbt on how to use this connector.
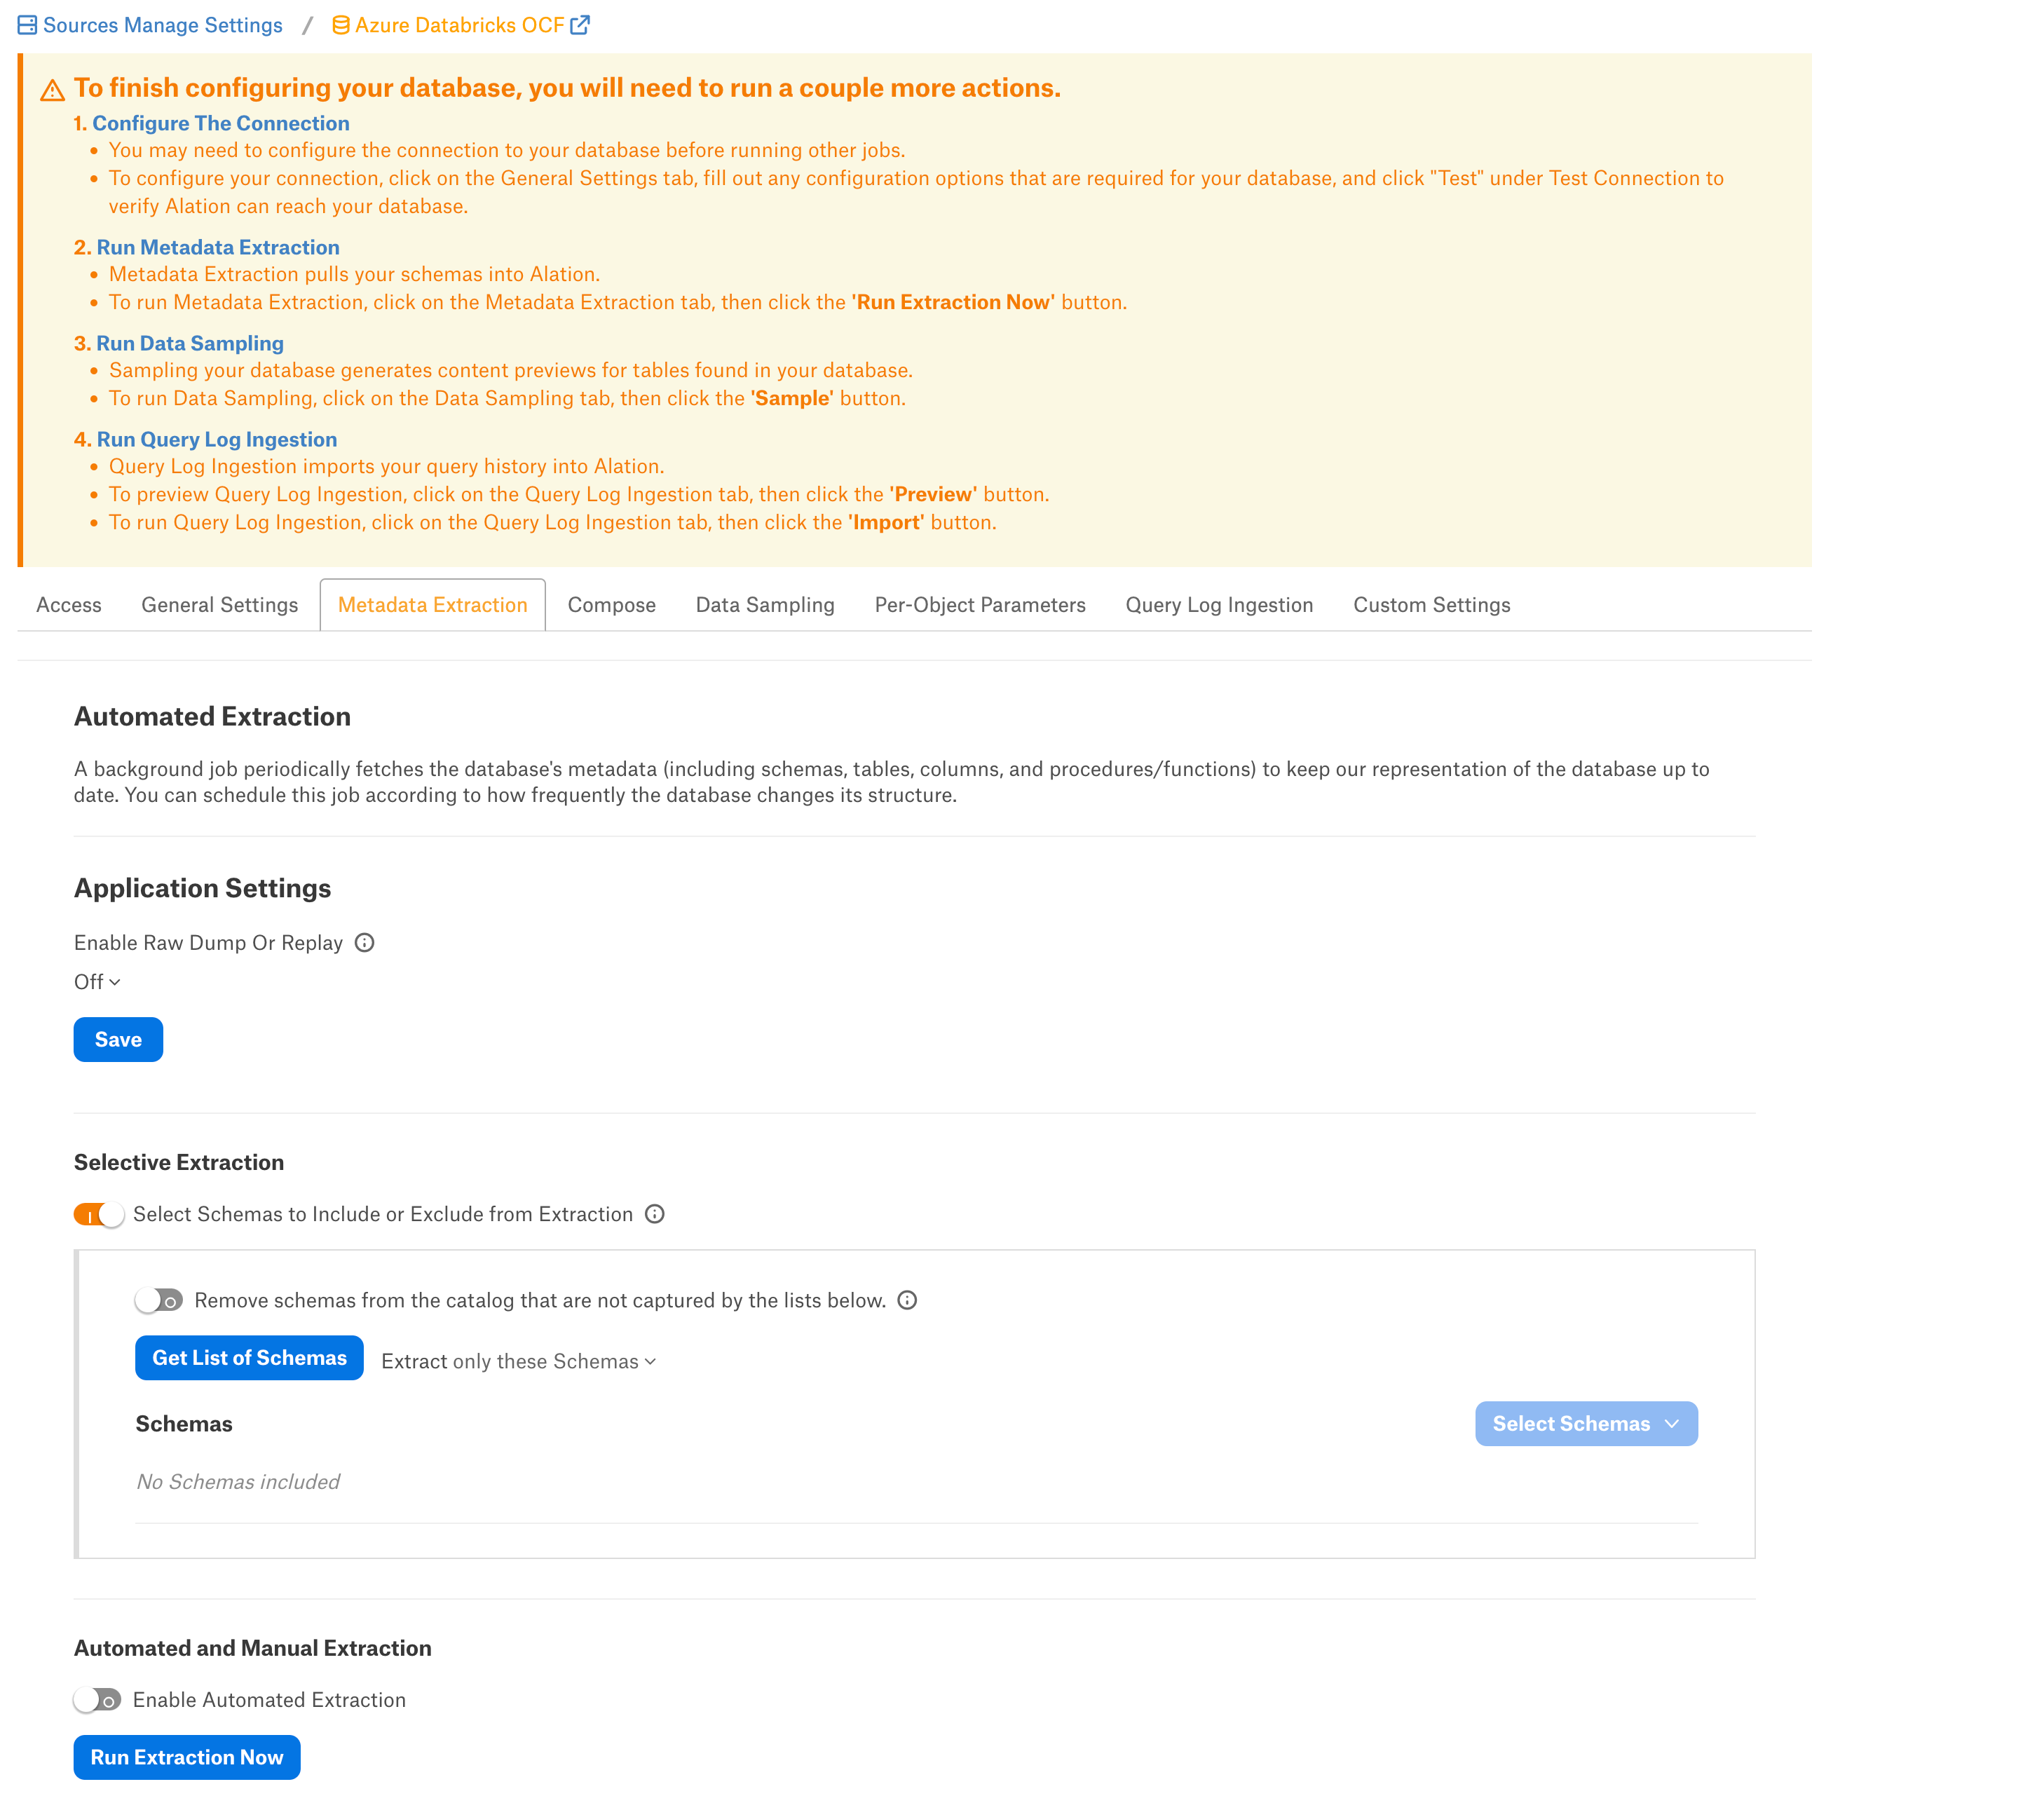
Metadata Extraction
You can configure metadata extraction (MDE) for an OCF data source on the Metadata Extraction tab of the Settings page. Refer to Configure Metadata Extraction for OCF Data Sources for information about the available configuration options.
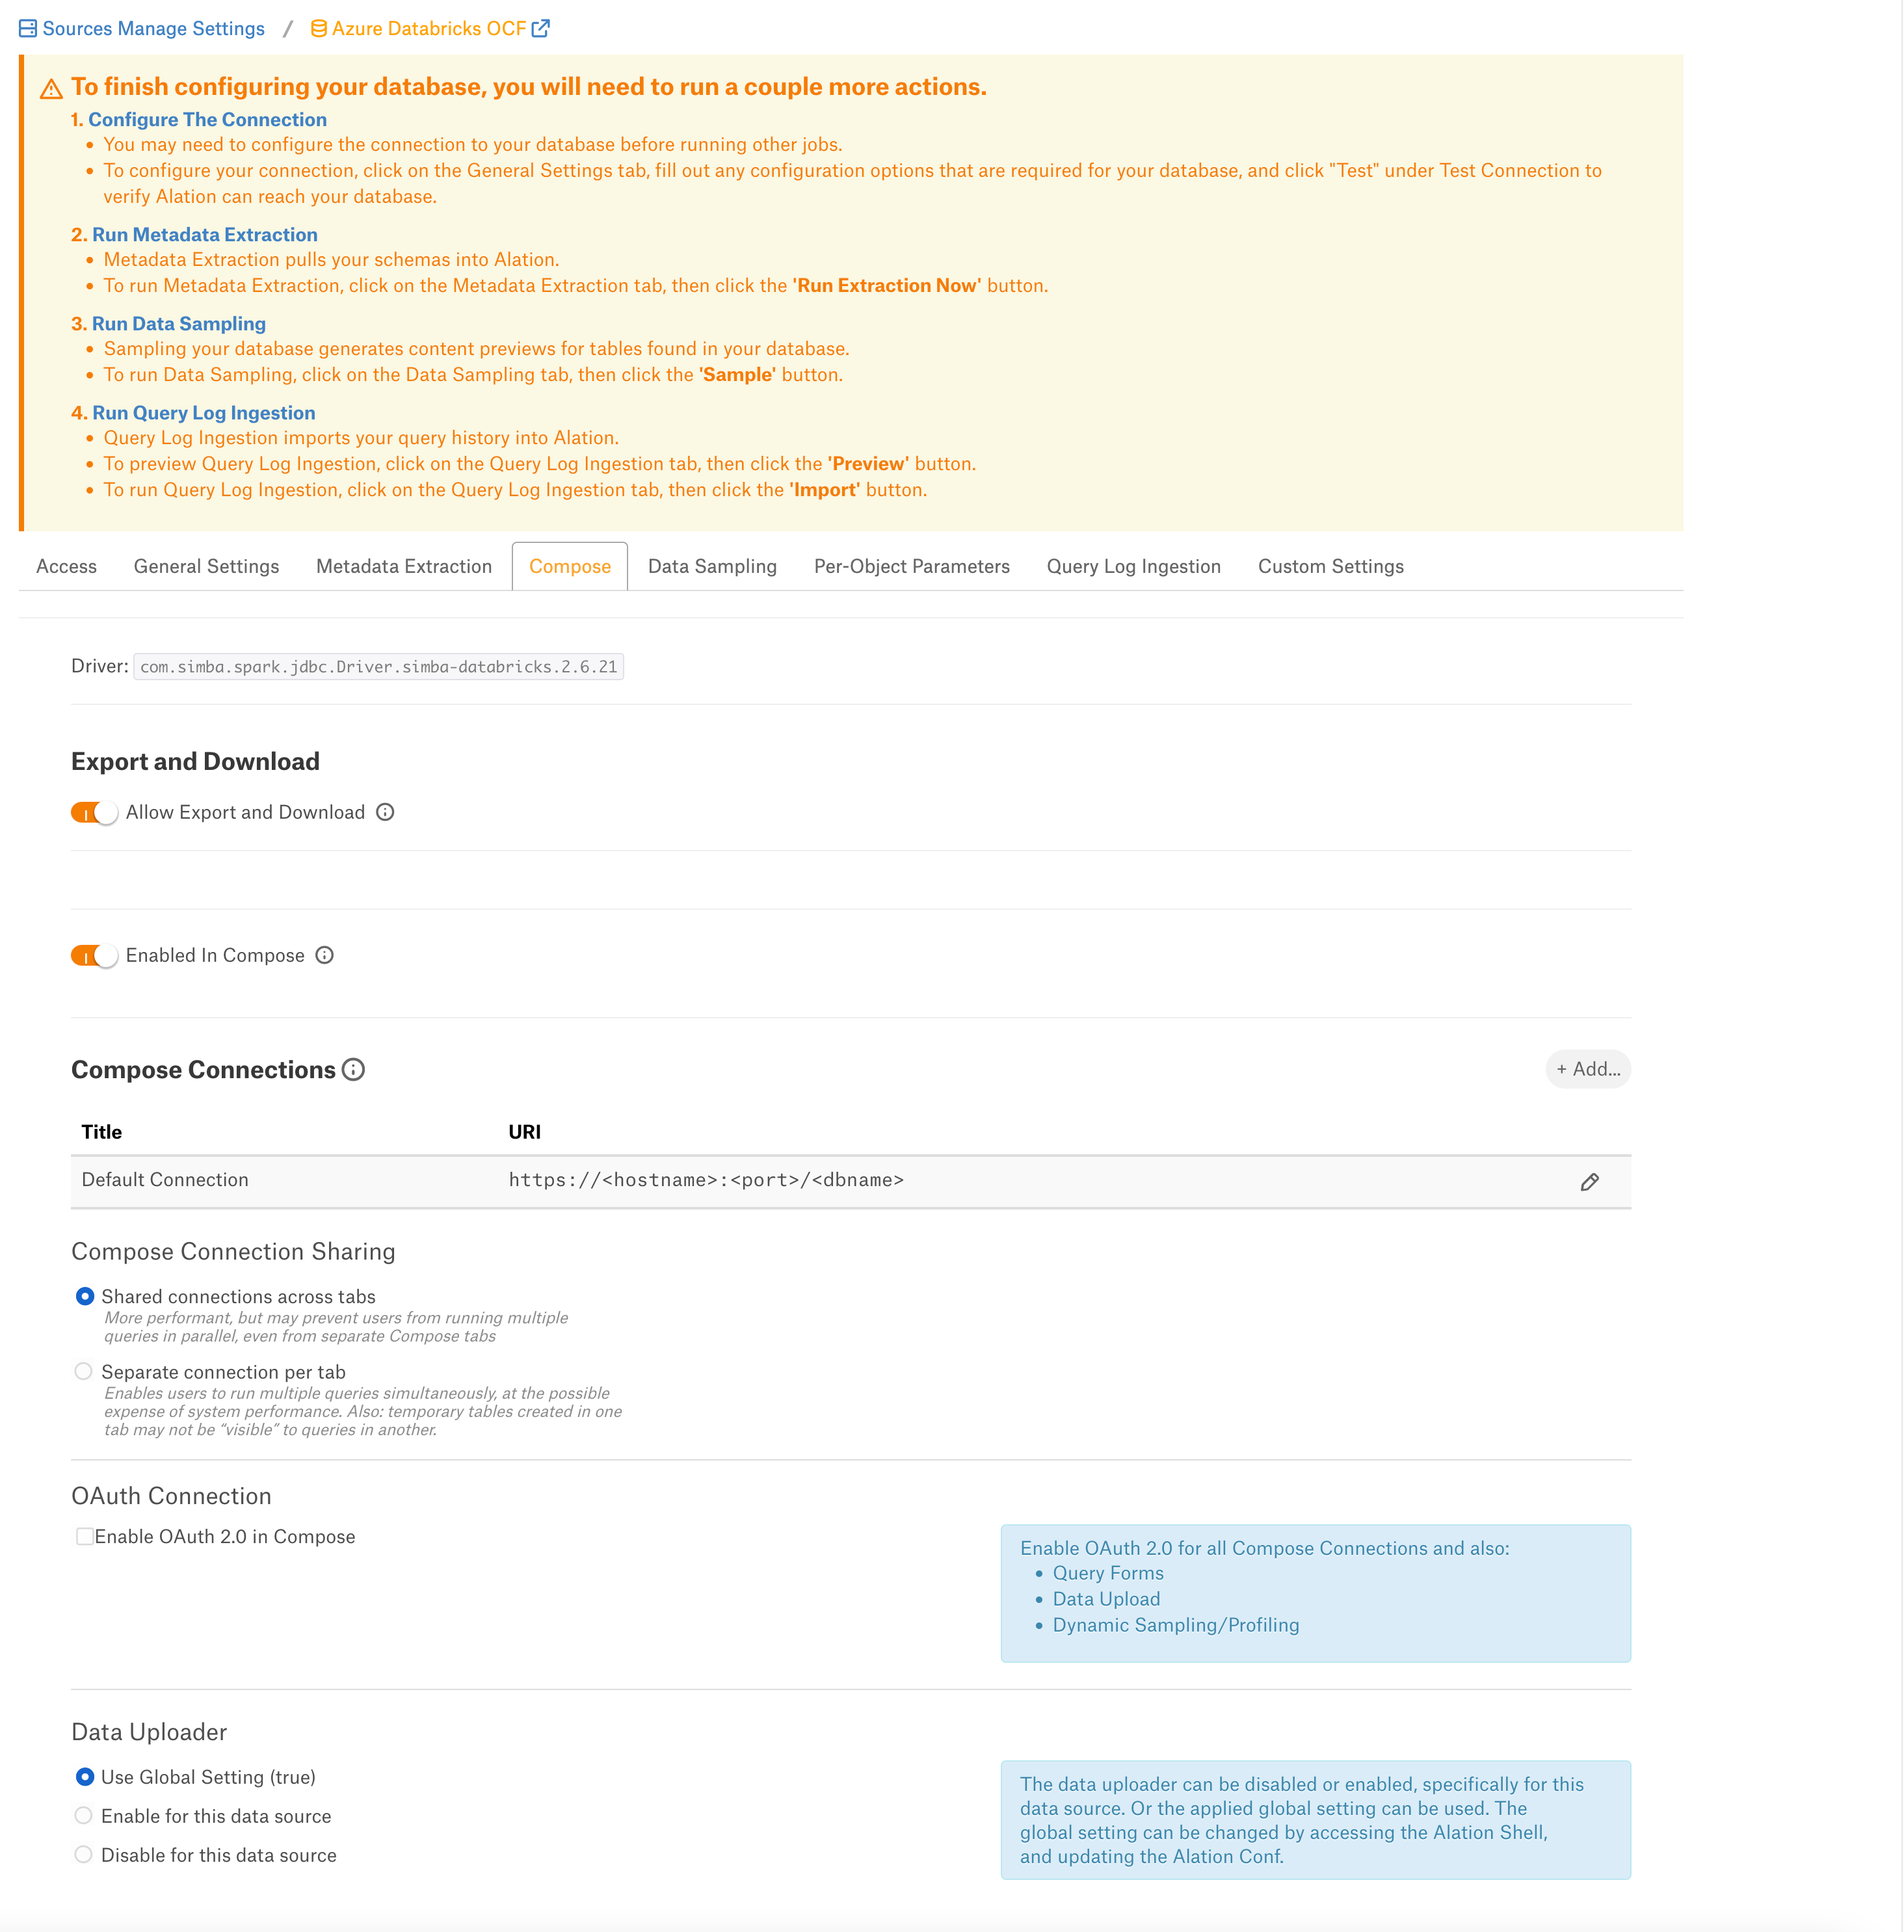
Compose
For details about configuring the Compose tab of the Settings, refer to Configure Compose for OCF Data Sources.
If you want to configure OAuth authentication for Compose, additionally see Azure Databricks OAuth for User Connections.
Sampling and Profiling
Sampling and profiling is supported. For details, see Configure Sampling and Profiling for OCF Data Sources.
Important
If you are going to use custom query-based sampling and profiling, ensure that the JDBC URI includes the
UseNativeQuery=0property. If you enable dynamic profiling, then users should ensure that their individual connections also include this property.
Query Log Ingestion
On the Query Log Ingestion tab, you can select the QLI options for your data source and schedule the QLI job if necessary. Refer to Azure Databricks OCF Connector: Query Log Ingestion for details about QLI from Azure Databricks.
Troubleshooting
Problem: Fetch Schemas fails with error “unable to instantiate HiveMetastoreClient”
The issue may occur when Hive metastore is not instantiated. Hive Metastore is the default Databricks connection catalog.
Solution
- Include the ConnCatalog and ConnSchema parameters into the connection JDBC URI:
ConnCatalog- Specifies the catalog which contains the metadata schema.ConnSchema- Specifies the schema inside the catalog in which metadata is stored.
Example:
ConnCatalog=en_dlake_cat;ConnSchema=data_governance;
Refer to Troubleshooting.