Overview of High Availability
Customer Managed Applies to customer-managed instances of Alation
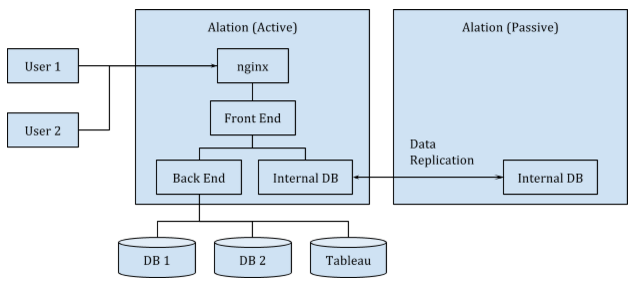
Alation supports High Availability (HA) through warm standby. Primary (Active) instances in Alation will take traffic, while Secondary (Passive) instances will run a minimal set of processes to sync data. Primary and Secondary instances should have identical specs. The Secondary server does not handle any traffic and is used for data replication purposes. In the event of failure on Primary, Secondary is promoted to the Active status through manual intervention.
Note
In addition to your HA pair, Alation recommends deploying a third instance - Test instance - for Production environments that can be used to test Alation patches before they are applied on the Alation Production servers. Test server specs should be similar to the specs of the Production servers.
Non-production and POC installations generally are not set up in HA mode, so only one server is required.
HA Diagram:

Configuration Sync
Application and system configuration is pulled by the Secondary node from the Primary node every minute using rsync.
Data Sync
Alation application data is spread across three different DBs - Postgres, KVStore, and Elasticsearch. Each DB except Elasticsearch is replicated to the Secondary node.
Postgres data is written to the Primary node and pushed to the Secondary node using Postgres WAL Log sync mechanism.
KVStore data is first written to the Secondary node then written to the Primary node. Network outages between Primary and Secondary can severely impact KVStore operation.
The Elasticsearch index has to be rebuilt on the Secondary node after failover.
Alation Replication Status
You can check the status of Postgres replication by visiting the replication page at <your_alation_URL>/monitor/replication. It will return the byte lag for Postgres, if replication is currently running. If replication is not running, it will return “unknown”, and this may be indicative of replication failure.
Sample output from replication page:
{
   "10.11.2.60":{
      "postgres_lag_bytes":"0"
   },
   "replication_mode":"master"
}
If postgres_lag_bytes is large and increasing, this may indicate an issue if the server is
in a low load state or if replication was recently set up. You may need to provide a faster machine to keep up.
Note
We currently do not have a way to monitor the replication state of KVStore.
