Appendix
A.1a SQL Server Extended Events Session Creation
Query to create extended events session
-- Query to create an extended events session
CREATE EVENT SESSION [alation_query_log] ON SERVER
  ADD EVENT sqlserver.sp_statement_completed
      (
      ACTION
        (
        package0.collect_system_time,
        package0.event_sequence,
        sqlos.task_time,
        sqlserver.client_app_name,
        sqlserver.database_id,
        sqlserver.database_name,
        sqlserver.nt_username,
        sqlserver.server_principal_name,
        sqlserver.server_principal_sid,
        sqlserver.session_id,
        sqlserver.session_nt_username,
        sqlserver.transaction_id,
        sqlserver.username
        )
      WHERE
        -- Lineage and context queries:
          (
            [sqlserver].[is_system] = 0
            -- add other databases you want to exclude e.g. test/dev databases, etc.
            -- AND [sqlserver].[database_name] <> 'master' -- uncomment this if you do not want queries from master database
            AND [sqlserver].[database_name] <> 'model'
            AND [sqlserver].[database_name] <> 'msdb'
            AND [sqlserver].[database_name] <> 'tempdb'
            -- Filter for specific databases, Provide appropriate database names instead of placeholder names DB1, DB2, DB3, etc.
            -- AND ( [sqlserver].[database_name] = N'DB1' OR [sqlserver].[database_name] = N'DB2' )
            -- Or alternatively, use database_id. Use database_id for high performance
            -- AND ( [sqlserver].[database_id] = <integer1> OR [sqlserver].[database_id] = <integer2> )
            -- Add other users you want to exclude e.g. monitoring software users, sa etc.
            AND [sqlserver].[username] <> N'NT SERVICE\SQLTELEMETRY'
            AND [sqlserver].[username] <> 'sys'
            AND [sqlserver].[username] <> 'INFORMATION_SCHEMA'
            -- Filter for specific databases, add more OR conditions for users if required
            -- AND [sqlserver].[username] = N'<user>'
            -- Add any other apps you want to exclude; SSMS queries are not excluded by the filters below
            AND [client_app_name] <> 'Microsoft SQL Server Management Studio - Transact-SQL IntelliSense'
            AND [client_app_name] <> 'Microsoft SQL Server Management Studio'
            -- stubborn statements (add more if needed)
            AND [statement] NOT LIKE 'SELECT StatMan%'
            AND
                (
                    [statement] like 'ALTER%' OR
                    [statement] like 'CREATE%' OR
                    [statement] like 'DROP%' OR
                    [statement] like 'TRUNCATE%' OR
                    [statement] like 'MERGE%' OR
                    [statement] like 'SELECT%INTO%' OR
                    [statement] like 'INSERT%INTO%FROM %' OR
                    [statement] like 'UPDATE%FROM%' OR
                    [statement] like 'USE%' OR
                    [statement] LIKE 'SELECT%FROM%' OR
                    [statement] like 'EXEC%' OR
                    [statement] like '%ALTER%' OR
                    [statement] like '%CREATE%' OR
                    [statement] like '%DROP%' OR
                    [statement] like '%TRUNCATE%' OR
                    [statement] like '%MERGE%' OR
                -- INSERT statements can be of type "SELECT INTO ..." or "INSERT INTO ..."
                    [statement] like '%SELECT%INTO%' OR
                    [statement] like '%INSERT%INTO%FROM%' OR
                    [statement] like '%UPDATE%FROM %' OR
                    [statement] like '%USE%' OR
                    [statement] like '%EXEC%' OR
                    [statement] LIKE '%SELECT%FROM%' OR
                    [statement] like '%FROM%'
                )
            -- If the files are filling quickly (i.e. too many events)
            -- un-comment next line to only write 1 out of every 20 logs to the .xel files
            -- However one could potentially miss lineage and important queries
            -- All events still get processed; this setting only
            -- controls what gets logged to the .xel files
            -- If you want 25% of queries written change the integer to "4", etc.
            -- AND package0.divides_by_uint64(package0.counter, 20)
        )
    ),
      ADD EVENT sqlserver.sql_statement_completed
          (
          SET collect_statement=(1)
          ACTION
              (
                package0.collect_system_time,
                package0.event_sequence,
                sqlos.task_time,
                sqlserver.client_app_name,
                sqlserver.database_id,
                sqlserver.database_name,
                sqlserver.nt_username,
                sqlserver.server_instance_name,
                sqlserver.server_principal_name,
                sqlserver.session_id,
                sqlserver.session_nt_username,
                sqlserver.transaction_id,
                sqlserver.username
              )
    -- Generic Alation filters, we only make use of certain types of statements
    -- Note SELECT is omitted because SELECT without FROM is not useful for our analysis
          WHERE
            -- Lineage and context queries:
            (
              [sqlserver].[is_system] = 0
              -- add other databases you want to exclude e.g. test/dev databases, etc.
              -- AND [sqlserver].[database_name] <> 'master' -- uncomment this if you do not want queries from master database
              AND [sqlserver].[database_name] <> 'model'
              AND [sqlserver].[database_name] <> 'msdb'
              AND [sqlserver].[database_name] <> 'tempdb'
              -- Filter for specific databases, Provide appropriate database names instead of placeholder names DB1, DB2, DB3, etc.
              -- AND ( [sqlserver].[database_name] = N'DB1' OR [sqlserver].[database_name] = N'DB2' )
              -- Or alternatively, use database_id. Use database_id for high performance
              -- AND ( [sqlserver].[database_id] = <integer1> OR [sqlserver].[database_id] = <integer2> )
              -- Add other users you want to exclude e.g. monitoring software users, sa etc.
              AND [sqlserver].[username] <> N'NT SERVICE\SQLTELEMETRY'
              AND [sqlserver].[username] <> 'sys'
              AND [sqlserver].[username] <> 'INFORMATION_SCHEMA'
              -- Filter for specific databases, add more OR conditions for users if required
              -- AND [sqlserver].[username] = N'<user>'
              -- Add any other apps you want to exclude; SSMS queries are not excluded by the filters below
              AND [client_app_name] <> 'Microsoft SQL Server Management Studio - Transact-SQL IntelliSense'
              AND [client_app_name] <> 'Microsoft SQL Server Management Studio'
              -- statements that show up but you don't want to log(add more if needed)
              AND [statement] NOT LIKE 'SELECT host_platform FROM sys.dm_os_host_info'
              AND [statement] NOT LIKE 'SELECT dtb.name AS [Name], dtb.state AS [State] FROM master.sys.databases dtb'
              AND
                    (
                    [statement] like 'ALTER%' OR
                    [statement] like 'CREATE%' OR
                    [statement] like 'DROP%' OR
                    [statement] like 'TRUNCATE%' OR
                    [statement] like 'MERGE%' OR
                    [statement] like 'SELECT%INTO%' OR
                    [statement] like 'INSERT%INTO%FROM %' OR
                    [statement] like 'UPDATE%FROM%' OR
                    [statement] like 'USE%' OR
                    [statement] like 'EXEC%' OR
                    [statement] LIKE 'SELECT%FROM%' OR
                    [statement] like '%ALTER%' OR
                    [statement] like '%CREATE%' OR
                    [statement] like '%DROP%' OR
                    [statement] like '%TRUNCATE%' OR
                    [statement] like '%MERGE%' OR
                -- INSERT statements can be of type "SELECT INTO ..." or "INSERT INTO ..."
                    [statement] like '%SELECT%INTO%' OR
                    [statement] like '%INSERT%INTO%FROM%' OR
                    [statement] like '%UPDATE%FROM %' OR
                    [statement] like '%USE%' OR
                    [statement] like '%EXEC%' OR
                    [statement] LIKE '%SELECT%FROM%' OR
                    [statement] like '%FROM%'
                    )
            -- If the files are filling quickly (i.e. too many events)
            -- un-comment next line to only write 1 out of every 20 logs to the .xel files
            -- However one could potentially miss lineage and important queries
            -- All events still get processed; this setting only
            -- controls what gets logged to the .xel files
            -- If you want 25% of queries written change the integer to "4", etc.
            -- AND package0.divides_by_uint64(package0.counter, 20)
            )
        )
      ADD TARGET package0.event_file
          (
          -- CONFIGURE THIS:
          SET filename=N'C:\Users\Public\Documents\alation_query_log.xel',
              -- Note: Alation will read one file at a time so this is the size of the file that may be read into memory while it is being fetched.
              -- max file size in MB before rolling over:
              max_file_size=(100), -- in MB
              max_rollover_files=(100)
          )
        WITH
            (
              -- OPTIONALLY CONFIGURE THIS. The total event buffer size:
            MAX_MEMORY=50 MB,
            -- If buffer is full, events will be dropped instead of blocking the server:
            EVENT_RETENTION_MODE=ALLOW_SINGLE_EVENT_LOSS,
            -- OPTIONALLY CONFIGURE THIS. Max time before writing events to storage:
            MAX_DISPATCH_LATENCY=30 SECONDS,
            -- Any events that are too large to fit in the buffer will be dropped:
            MAX_EVENT_SIZE=0 KB,
            MEMORY_PARTITION_MODE=NONE,
            TRACK_CAUSALITY=OFF,
            STARTUP_STATE=ON
            );
  GO
  -- Query to start the session (change START -> STOP to stop it)
  ALTER EVENT SESSION [alation_query_log] ON SERVER
  STATE = START;
  GO
Note
filename- Specify the xel file name comprising of absolute path and the file prefix. For example, C:\Users\Public\Documents\alation_query_log.xel. In this example, C:\Users\Public\Documents is the path and alation_query_log is the prefix.max_file_size- Specify the maximum file size. Once the file size exceeds the limit, the SQL Server creates a new file. Alation recommends a maximum file size of 100 MB before rolling over.max_rollover_files- Specify the maximum number of rollover xel files to create when file size exceeds the maximum file size specified (max_file_size). Once the limit exceeds, the SQL Server removes the oldest file and creates a new one. Alation recommends a maximum of 100 rollover files.MAX_MEMORY- Specify the maximum event buffer memory size. Once buffer memory is full, the SQL Server writes events to the file. Alation recommends a maximum buffer memory size of 50 MB the file IO operation.MAX_DISPATCH_LATENCY- Specify the maximum time in seconds after which SQL Server writes all events in the memory buffer to the file. Alation recommends a maximum of 30 seconds.
Note
The SQL Server performs the file write operation when either the MAX_DISPATCH_LATENCY or MAX_MEMORY limit is reached.
Query to Delete and Recreate the Session
If you want to recreate the session, you need to first drop the existing session.
Use the following query to delete a session:
DROP EVENT SESSION [alation_query_log] ON SERVER;
GO

-- Check if the session is dropping events and see other data about the session
Using Database ID instead of Database Name
If you wish to limit sampling to specific databases, you can either provide database_name or database_id.
To get the database id:
SELECT DB_ID ('database name')
This command can be run in SSMS or any query tool.
Provide the specific database id’s in place of <integer> in the appropriate sections of the query. Comments explain where you can alternatively use database_name or database_id:
AND [sqlserver].[database_id]=<integer>
A.1c SQL Server Trace Script
Adjust stoptime, tracefile, maxfilesize, and filecount variables in the script.
//
/* Created by: SQL Server 2012  Profiler          */
/* Date: 05/19/2015  00:27:35 AM                  */
//

-- Create a Queue
declare @rc int
declare @TraceID int
declare @maxfilesize bigint
declare @stoptime datetime
declare @filecount int
declare @tracefile nvarchar(245)

-- maxfilesize is in MB
set @maxfilesize = 1024
-- Set stoptime to NULL to run forever
set @stoptime = '2015-06-19 15:06:00.000'
-- Max number of rotated trace files to keep
set @filecount = 40

-- Please replace the text InsertFileNameHere, with an appropriate
-- filename prefixed by a path, for example, c:MyFolderMyTrace. The .trc extension
-- will be appended to the filename automatically. If you are writing from
-- remote server to local drive, please use UNC path and make sure server has
-- write access to your network share
set @tracefile = N'c:AlationServerTrace1'

exec @rc = sp_trace_create @TraceID output, 2, @tracefile, @maxfilesize, @stoptime, @filecount
if (@rc != 0) goto error

-- Client side File and Table cannot be scripted

-- Set the events required by Alation
declare @on bit
set @on = 1
exec sp_trace_setevent @TraceID, 45, 1, @on
exec sp_trace_setevent @TraceID, 45, 6, @on
exec sp_trace_setevent @TraceID, 45, 10, @on
exec sp_trace_setevent @TraceID, 45, 11, @on
exec sp_trace_setevent @TraceID, 45, 12, @on
exec sp_trace_setevent @TraceID, 45, 13, @on
exec sp_trace_setevent @TraceID, 45, 14, @on
exec sp_trace_setevent @TraceID, 45, 15, @on
exec sp_trace_setevent @TraceID, 45, 16, @on
exec sp_trace_setevent @TraceID, 45, 17, @on
exec sp_trace_setevent @TraceID, 45, 18, @on
exec sp_trace_setevent @TraceID, 45, 35, @on
exec sp_trace_setevent @TraceID, 45, 48, @on
exec sp_trace_setevent @TraceID, 41, 1, @on
exec sp_trace_setevent @TraceID, 41, 6, @on
exec sp_trace_setevent @TraceID, 41, 10, @on
exec sp_trace_setevent @TraceID, 41, 11, @on
exec sp_trace_setevent @TraceID, 41, 12, @on
exec sp_trace_setevent @TraceID, 41, 13, @on
exec sp_trace_setevent @TraceID, 41, 14, @on
exec sp_trace_setevent @TraceID, 41, 15, @on
exec sp_trace_setevent @TraceID, 41, 16, @on
exec sp_trace_setevent @TraceID, 41, 17, @on
exec sp_trace_setevent @TraceID, 41, 18, @on
exec sp_trace_setevent @TraceID, 41, 35, @on
exec sp_trace_setevent @TraceID, 41, 48, @on

-- Set the Filters
declare @intfilter int
declare @bigintfilter bigint

-- Filter out all queries by Trace: ApplicationName NOT LIKE 'SQL Server Profiler%'
exec sp_trace_setfilter @TraceID, 10, 0, 7, N'SQL Server Profiler%'
-- Filter out all queries by SQL Server Mgmt Studio IntelliSense
exec sp_trace_setfilter @TraceID, 10, 0, 7, N'%Transact-SQL
IntelliSense%'
-- Log only user queries: isSystem = 0
exec sp_trace_setfilter @TraceID, 60, 0, 0, 0

-- **
-- TODO: FILTER OUT OTHER UNWANTED QUERIES HERE
-- Filter Queries from a DB
-- NOTE: If your query doesn't explicitly call 'USE DB_NAME' then the DatabaseName
-- column will not be valid.
-- exec sp_trace_setfilter @TraceID, 35, 0, 0, N'MyDatabase'
-- **

-- Set the trace status to start
exec sp_trace_setstatus @TraceID, 1
-- display trace id for future references
select TraceID=@TraceID
goto finish
error:
select ErrorCode=@rc
finish:
go
A.1d SQL Server Ingestion from Custom Table Setup
The Alation SQL Server ingestion expects a table with specific columns. They are a subset of the SQL Profiler Data Columns.
The columns listed in both sections below must all be present. Some of the required columns must be present and correctly filled, others can have null values as they are not essential to the ingestion process.
Columns that are required to be filled correctly:
LoginName
SPID
TextData
StartTime
DatabaseName
EndTime (we filter out queries that haven’t finished so this can be faked by making it non null)
Columns that must be present but are not required for ingestion to function:
ApplicationName
Reads
Writes
CPU
RowCounts
NTUserName
EventClass
Duration
Additionally, in the logging process, we usually filter out queries that we know aren’t useful to Alation. You would know best what kind of queries are being logged but if there is a large volume you may need to filter them down before putting them in the table. We suggest the following filters:
TextData like ‘%ALTER %’ OR
TextData like ‘%CREATE %’ OR
TextData like ‘%DROP %’ OR
TextData like ‘%TRUNCATE %’ OR
TextData like ‘%MERGE %’ OR
TextData like ‘%FROM %’ OR
TextData like ‘%USE %’
A.2 Teradata Query Log View SQL
Use the following query to create a Query Log view.
Change
my_schema.qrylog_fullto a custom name.It is recommended to create
qrylog_fulltable in a schema owned by Alation DB account.
Note
If you archive queries in PDCR or another schema, change the source schema from DBC to the other schema.
DBC
CREATE VIEW MY_SCHEMA.QRYLOG_FULL AS
SELECT
   s.ProcID,
   s.CollectTimeStamp,
   s.QueryID,
   UserID,
   AcctString,
   ExpandAcctString,
   SessionID,
   LogicalHostID,
   RequestNum,
   InternalRequestNum,
   LogonDateTime,
   AcctStringTime,
   AcctStringHour,
   AcctStringDate,
   LogonSource,
   AppID,
   ClientID,
   ClientAddr,
   QueryBand,
   ProfileID,
   StartTime,
   FirstStepTime,
   FirstRespTime,
   LastStateChange,
   NumSteps,
   NumStepswPar,
   MaxStepsInPar,
   NumResultRows,
   TotalIOCount,
   AMPCPUTime,
   ParserCPUTime,
   UtilityByteCount,
   UtilityRowCount,
   ErrorCode,
   ErrorText,
   WarningOnly,
   ((firstresptime - starttime) hour(4) to second) (Named ElapsedTime),
   DelayTime,
   AbortFlag,
   CacheFlag,
   StatementType,
   StatementGroup,
   sqltextinfo AS QueryText,
   NumOfActiveAMPs,
   MaxAMPCPUTime,
   MaxCPUAmpNumber,
   MinAmpCPUTime,
   MaxAmpIO,
   MaxIOAmpNumber,
   MinAmpIO,
   SpoolUsage,
   WDID,
   OpEnvID,
   SysConID,
   LSN,
   NoClassification,
   WDOverride,
   ResponseTimeMet,
   ExceptionValue,
   FinalWDID,
   TDWMEstMaxRows,
   TDWMEstLastRows,
   TDWMEstTotalTime,
   TDWMAllAmpFlag,
   TDWMConfLevelUsed,
   TDWMRuleID,
   UserName,
   DefaultDatabase,
   AMPCPUTimeNorm,
   ParserCPUTimeNorm,
   MaxAMPCPUTimeNorm,
   MaxCPUAmpNumberNorm,
   MinAmpCPUTimeNorm,
   EstResultRows,
   EstProcTime,
   EstMaxRowCount,
   ProxyUser,
   ProxyRole,
   SessionTemporalQualifier,
   CalendarName,
   SessionWDID,
   DataCollectAlg,
   ParserExpReq,
   CallNestingLevel,
   NumRequestCtx,
   KeepFlag,
   QueryRedriven,
   ReDriveKind,
   CPUDecayLevel,
   IODecayLevel,
   TacticalCPUException,
   TacticalIOException,
   SeqRespTime,
   ReqIOKB,
   ReqPhysIO,
   ReqPhysIOKB,
   r.sqlrowno
FROM dbc.dbqlsqltbl r,
     dbc.dbqlogtbl s
WHERE r.queryid = s.queryid and r.procid = s.procid;
Reduced Query Log View
CREATE VIEW MY_SCHEMA.query_log_reduced AS
SELECT
   s.QueryID,
   UserID,
   SessionID,
   UserName,
   AppID,
   ClientID,
   ClientAddr,
   StartTime,
   sqltextinfo AS QueryText,
   ((firstresptime - starttime) hour(4) to second) (Named ElapsedTime),
   DelayTime,
   DefaultDatabase,
   AbortFlag,
   NumResultRows,
   TotalIOCount,
   AMPCPUTime,
   ErrorCode,
   ErrorText,
   RequestNum,
   LogonDateTime,
   r.sqlrowno
FROM dbc.dbqlsqltbl r,
    dbc.dbqlogtbl s
WHERE r.queryid = s.queryid and r.procid = s.procid;
PDCR
If PDCR tables are used, change the source schema (pdcr is used in this example) and add the date partition column (logDate is usually the partition column and is used in this example).
CREATE VIEW MY_SCHEMA.QRYLOG_FULL AS
SELECT
   s.ProcID,
   s.CollectTimeStamp,
   s.QueryID,
   UserID,
   s.logDate,
   AcctString,
   ExpandAcctString,
   SessionID,
   LogicalHostID,
   RequestNum,
   InternalRequestNum,
   LogonDateTime,
   AcctStringTime,
   AcctStringHour,
   AcctStringDate,
   LogonSource,
   AppID,
   ClientID,
   ClientAddr,
   QueryBand,
   ProfileID,
   StartTime,
   FirstStepTime,
   FirstRespTime,
   LastStateChange,
   NumSteps,
   NumStepswPar,
   MaxStepsInPar,
   NumResultRows,
   TotalIOCount,
   AMPCPUTime,
   ParserCPUTime,
   UtilityByteCount,
   UtilityRowCount,
   ErrorCode,
   ErrorText,
   WarningOnly,
   ((firstresptime - starttime) hour(4) to second) (Named ElapsedTime),
   DelayTime,
   AbortFlag,
   CacheFlag,
   StatementType,
   StatementGroup,
   sqltextinfo AS QueryText,
   NumOfActiveAMPs,
   MaxAMPCPUTime,
   MaxCPUAmpNumber,
   MinAmpCPUTime,
   MaxAmpIO,
   MaxIOAmpNumber,
   MinAmpIO,
   SpoolUsage,
   WDID,
   OpEnvID,
   SysConID,
   LSN,
   NoClassification,
   WDOverride,
   ResponseTimeMet,
   ExceptionValue,
   FinalWDID,
   TDWMEstMaxRows,
   TDWMEstLastRows,
   TDWMEstTotalTime,
   TDWMAllAmpFlag,
   TDWMConfLevelUsed,
   TDWMRuleID,
   UserName,
   DefaultDatabase,
   AMPCPUTimeNorm,
   ParserCPUTimeNorm,
   MaxAMPCPUTimeNorm,
   MaxCPUAmpNumberNorm,
   MinAmpCPUTimeNorm,
   EstResultRows,
   EstProcTime,
   EstMaxRowCount,
   ProxyUser,
   ProxyRole,
   SessionTemporalQualifier,
   CalendarName,
   SessionWDID,
   DataCollectAlg,
   ParserExpReq,
   CallNestingLevel,
   NumRequestCtx,
   KeepFlag,
   QueryRedriven,
   ReDriveKind,
   CPUDecayLevel,
   IODecayLevel,
   TacticalCPUException,
   TacticalIOException,
   SeqRespTime,
   ReqIOKB,
   ReqPhysIO,
   ReqPhysIOKB,
   r.sqlrowno
FROM pdcr.dbqlsqltbl r,
    pdcr.dbqlogtbl s
WHERE r.queryid = s.queryid
  AND r.procid = s.procid
  AND r.logDate = s.logDate;
If my_schema is not owned by the Alation DB account, provide SELECT
privileges to the Alation DB account on Query Log view by running the
following queries:
GRANT SELECT ON DBC TO MY_SCHEMA WITH GRANT OPTION;
GRANT SELECT ON MY_SCHEMA TO ALATION_DB_USER;
Verify the setup by running the following query asalation_db_user.
SELECT COUNT(*) FROM MY_SCHEMA.QRYLOG_FULL;
Typical query run during extraction by alation_db_user:
SELECT * FROM MY_SCHEMA.QRYLOG_FULL WHERE <...>
A.3 Oracle Query Log View
Oracle QLI View using ASH table
CREATE
OR REPLACE VIEW <schema>.alation_query_log_view AS
SELECT
  r.begin_interval_time,
  r.dbid,
  r.snap_id,
  b.username AS user_name,
  b.username ||'/'|| r.session_id ||'/'|| r.session_serial# ||'/'|| r.instance_number AS session_id,
  r.instance_number,
  r.sql_id,
  r.sample_id,
  r.service_hash,
  r.client_id,
  r.machine,
  r.port,
  s.command_type,
  s.sql_text,
  r.start_time,
  r.cpu_time_ms,
  r.time_ms,
  r.db_time_ms,
  r.time2_ms,
  r.read_io_requests,
  r.write_io_requests,
  r.read_io_bytes,
  r.write_io_bytes,
  r.interconnect_io_bytes,
  r.max_pga_mem,
  r.max_temp_space,
  r.machine ||':'|| r.port AS client_addr,
  0 AS returncode,
  0 AS process_id,
  NULL AS session_start_time
FROM
  (
    SELECT
      s.begin_interval_time,
      a.DBID,
      a.snap_id,
      a.user_id,
      a.session_id,
      a.session_serial#,
      a.sql_id,
      a.sample_id,
      a.service_hash,
      a.client_id,
      a.machine,
      a.port,
      a.instance_number,
      MIN(a.sample_time) AS start_time,
      SUM(a.tm_delta_cpu_time) AS cpu_time_ms,
      SUM(a.tm_delta_time) AS time_ms,
      SUM(a.tm_delta_db_time) AS db_time_ms,
      SUM(a.delta_time) AS time2_ms,
      SUM(a.delta_read_io_requests) AS read_io_requests,
      SUM(a.delta_write_io_requests) AS write_io_requests,
      SUM(a.delta_read_io_bytes) AS read_io_bytes,
      SUM(a.delta_write_io_bytes) AS write_io_bytes,
      SUM(a.delta_interconnect_io_bytes) AS interconnect_io_bytes,
      MAX(a.pga_allocated) AS max_pga_mem,
      MAX(a.temp_space_allocated) AS max_temp_space
    FROM
      dba_hist_active_sess_history a
      JOIN dba_hist_snapshot s ON a.dbid = s.dbid
      AND a.snap_id = s.snap_id
      AND a.instance_number = s.instance_number
    GROUP BY
      a.dbid,
      a.snap_id,
      a.user_id,
      a.session_id,
      a.session_serial#,
      a.sql_id,
      a.sample_id,
      a.service_hash,
      a.client_id,
      a.machine,
      a.port,
      s.begin_interval_time,
      a.instance_number
  ) r
  JOIN dba_users b ON r.user_id = b.user_id
  JOIN dba_hist_sqltext s ON r.dbid = s.dbid
  AND r.sql_id = s.sql_id
WHERE
  s.command_type NOT IN (
    6, 7, /* system cmds */
    47, /* declare cmd */
    170, 189
  )
  AND b.username NOT IN (
    'SYSTEM',
    'SYS',
    'OLAPSYS',
    'LBACSYS',
    'OWBSYS',
    'OWBSYS_AUDIT',
    'APPQOSSYS',
    'SYSMAN',
    'WMSYS',
    'EXFSYS',
    'CTXSYS',
    'ORDSYS',
    'MDSYS'
  );
A.4 Vertica Query Log
-- SQL to create the query log table that Alation will read from. Drop is only require
-- You can choose any name for the table and any name for ‘alation_app’
-- You will enter these names in the Alation UI to configure Query Ingestion
DROP TABLE IF EXISTS public.alation_qrylog_table;CREATE TABLE public.alation_qrylog_table (
  session_id varchar(128),
  user_name varchar(128),
  start_timestamp timestamptz,
  end_timestamp timestamptz,
  request_duration_ms int,
  request_id int,
  request varchar(64000),
  canceled varchar(6),
  search_path varchar(64000)
);
GRANT SELECT
  ON public.alation_qrylog_table TO alation_app;
  -- You can use this query to check the current size given to the Requests Issued
  -- collector. You may need to increase the size if your query volume is high because
  -- the queries may be gone by the time the ETL runs to copy them over to the alation
  -- table. The ETL copies the previous days queries over so you need at least enough
  -- to store two days worth of queries.
SELECT * FROM V_MONITOR.DATA_COLLECTOR
  WHERE
    component = 'RequestsIssued';
  -- ETL SQL to move queries from Vertica system tables to the Alation query log table.
  -- Run this query every day, preferably towards the end of the data in case
  -- any queries from the previous day are still running.
  -- Alation ingests the day two days behind the current date so as long as the ETL is done
  -- by then Alation will not miss any queries.
INSERT INTO
  alation_qrylog_table
SELECT * FROM (
    SELECT
      ri.session_id,
      ri.user_name,
      qr.start_timestamp,
      qr.end_timestamp,
      qr.request_duration_ms,
      ri.request_id,
      ri.request,
      CASE WHEN qr.success THEN '' ELSE 'FAILED' END as canceled,
      qr.search_path
    FROM
      v_internal.dc_requests_issued ri
      JOIN v_monitor.query_requests qr ON ri.transaction_id = qr.transaction_id
      AND ri.request_id = qr.request_id
      AND ri.session_id = qr.session_id
    WHERE
      date(start_timestamp) > CURRENT_DATE - 1
      and date(start_timestamp) <= CURRENT_DATE
  ) AS alation_querylog;
  -- Optional ETL to delete rows from the query log table to save space.
  -- If Alation auto ingestion is enabled it will continually ingest the queries from this
  -- table each day. It may lag a few days behind the current date so it is safe to delete
  -- rows older than a week.
DELETE FROM
  public.alation_qrylog_table
WHERE
  date(start_timestamp) < CURRENT_DATE - 7;
A.5 Netezza Query Log View
Netezza supports Query History version 2 and Query History version 3. Alation does not support Query History version 1.
Description |
Query History version 2 |
Query History version 3 |
|---|---|---|
Netezza Release |
IBM® Netezza® release |
In release 7.1, the |
version |
7.0.3 introduces a new version of the history database to support schema in the Netezza database. |
query history configuration version is incremented from 2 to 3. |
The parameters {query_prolog}, {query_epilog}, and {session_prolog} will be
replaced in the query as listed in the following table.
Parameter |
History Version 2 view |
History Version 3 view |
|---|---|---|
|
|
|
|
|
|
|
|
|
Follow the steps as listed to view the query log for Netezza.
Log in to the system database as an admin user.
Create query history load user (optional user):
CREATE USER test_history_load WITH PASSWORD 'password';
Create query history owner user or a mandatory user. If the history load user is not created, it is a load user:
CREATE USER test_history_owner WITH PASSWORD 'password';
Grant Create Database to test_history_owner:
GRANT CREATE DATABASE TO test_history_owner;
Grant List on test_history_load to USER test_history_owner if it is used as load user:
GRANT LIST ON test_history_load TO test_history_owner;
Create a history database:
nzhistcreatedb -d hist -n netezza.alation.internal -t Q -o test_history_owner -p password -u test_history_load -v {version}
Replace the value of
{version}with 2 for History Version 2 and 3 for History Version 3.Create query history configuration based on database. Replace the value of
{configuration name}oftest_hist_v2for History Version 2 and a value oftest_hist_v3for History Version 3.CREATE HISTORY CONFIGURATION {configuration name} HISTTYPE QUERY DATABASE hist USER test_history_owner PASSWORD 'password' COLLECT QUERY LOADINTERVAL 0 LOADMINTHRESHOLD 0 LOADMAXTHRESHOLD 20 STORAGELIMIT 40 LOADRETRY 2 VERSION {version};
Set Query History configuration.
SET HISTORY CONFIGURATION {configuration name}Stop Netezza
nzstop
Start Netezza
nzstart
Log in database
histwithtest_history_ownerCreate a schema and view for Query Log Ingestion (QLI).
CREATE SCHEMA netezza_test_query_log_sch;
CREATE VIEW netezza_test_query_log_sch.netezza_test_query_log AS SELECT
  qp.opid,
  sp.connecttime,
  qe.npsid,
  qe.npsinstanceid,
  qe.sessionid,
  qe.resultrows,
  qe.status,
  qe.finishtime,
  qp.userid,
  qp.username,
  qp.submittime,
  qp.querytext,
  qp.dbname,
  qp.dbid,
  qp.schemaid,
  qp.schemaname,
  date_part ('epoch', finishtime - submittime) AS runtime_seconds
FROM
  {query_prolog} qp
  JOIN {query_epilog} qe ON qp.opid = qe.opid
    AND qp.npsid = qe.npsid
    AND qp.npsinstanceid = qe.npsinstanceid
    AND qp.sessionid = qe.sessionid
  JOIN {session_prolog} sp ON sp.npsid = qe.npsid
    AND sp.npsinstanceid = qe.npsinstanceid
    AND sp.sessionid = qe.sessionid
    AND qp.querytext not in (
      'commit', 'COMMIT',
      'begin', 'BEGIN',
      'select current_catalog’, ‘current_schema’, ‘current_user',
      'select identifier_case’, ‘current_catalog’, ‘current_user',
      'select db_encoding', 'select nchar_encoding'
  )
  AND qp.querytext not like 'select version()%'
  AND qp.querytext not like 'set client_version%'
  AND qp.querytext not like 'SET CLIENT_VERSION%'
  AND qp.querytext not like 'set nz_encoding%'
  AND qp.querytext not like 'set datestyle %'
  AND qp.querytext not like 'set DateStyle %'
  AND qp.querytext not like 'SET timezone %'
  AND qp.querytext not like 'SET TRANSACTION %'
  AND qp.querytext not like '%JDBC Client Version%';
Result query validation:
SELECT count(*) FROM netezza_test_query_log_sch.netezza_test_query_log;
The validation result should not be zero.
Connect to the system database as an admin and grant permission to <alation_service_account>:
GRANT LIST ON <alation_service_account> TO test_history_owner;
GRANT ALTER ON  <alation_service_account> TO test_history_owner;
Connect to
histdatabase usingtest_history_owneruser and give permission to <alation_service_account> to runhist.netezza_test_query_log_sch.netezza_test_query_logview:GRANT SELECT ON hist.netezza_test_query_log_sch.netezza_test_query_log TO <alation_service_account>;
Connect to system database using extraction user
<alation_service_account>:SELECT COUNT(*) FROM hist.netezza_test_query_log_sch.netezza_test_query_log;
Verify results. The validation result should not be zero.
How do you capture history for a particular database?
ALTER DATABASE <db_name> COLLECT HISTORY {ON DEFAULT}
Field |
Description of value |
|---|---|
COLLECT HISTORY |
Creation of a database: Collection of history for session attached to the database. If the value is set to ON, history is collected only if the user is a member of at least one group. The COLLECT HISTORY is set to ON and is the default value. If the value is set to OFF, history is not collected for the database. If the value is set to DEFAULT, history is collected for the database only if the user is a member of at least one group. The COLLECT HISTORY is set to ON and one of the following criteria apply:
|
How do you capture history for a particular user group <group_name> ?
ALTER GROUP <group_name> WITH COLLECT HISTORY {ONDEFAULT}
How to add a particular user <user_name> to group <group_name> for which COLLECT HISTORY is ON or DEFAULT?
ALTER GROUP <group_name> ADD <user_name>
Field |
Description of value |
|---|---|
COLLECT HISTORY |
If the system should collect history of data for the session of a user who is a member of the group: If the value is set to ON, history is collected only if the user is connected to a database and the COLLECT HISTORY is set to ON. If the value is set to OFF, history is not collected for the database. If the value is set to DEFAULT, history is collected for the user only if the user is connected to a database and the COLLECT HISTORY is set to ON and one of the following criteria apply:
|
A.6 Postgres QLI Setup
CSV Logging with No Log Rotation
First you need to change the server configuration (postgresql.conf) and enable CSV logging as described in detail here and reload.
# set in postgresql.conf + restart/reload server (changing logging_collector needs a restart)

log_destination ='csvlog'

log_directory = 'pg_log'

logging_collector = on

log_filename = 'postgresql'

log_min_duration_statement = 0

log_error_verbosity = verbose      # terse, default, or verbose messages

log_hostname = on

log_statement = 'all'      # none, ddl, mod, all

log_rotation_age = 0

log_rotation_size = 0

log_min_error_statement = info
Reload the updated postgressql.conf as follows:
SELECT pg_reload_conf();Note
log_rotation_age = 0andlog_rotation_size = 0to stop rotation and all logs will be written to the same file, that is to the same table. The difference between setting this option and settinglog_min_duration_statementto zero is that exceedinglog_min_duration_statementforces the text of the query to be logged, butlog_durationdoesn’t.
Install the
file_fdwextension (contribpackage needed) and create a foreign file server and a foreign table, linking to our above configured log file name.CREATE EXTENSION file_fdw; CREATE SERVER pglog FOREIGN DATA WRAPPER file_fdw; CREATE FOREIGN TABLE public.postgres_log ( log_time timestamp(3) with time zone, user_name text, database_name text, process_id integer, connection_from text, session_id text, session_line_num bigint, command_tag text, session_start_time timestamp with time zone, virtual_transaction_id text, transaction_id bigint, error_severity text, sql_state_code text, message text, detail text, hint text, internal_query text, internal_query_pos integer, context text, query text, query_pos integer, location text, application_name text, backend_type text, empty_column text, column_with_zeroes text ) SERVER pglog OPTIONS (filename 'pg_log/postgresql.csv', format 'csv');
CREATE EXTENSION file_fdw;

CREATE SERVER pglog FOREIGN DATA WRAPPER file_fdw;

CREATE FOREIGN TABLE public.postgres_log (
    log_time timestamp(3) with time zone,
    user_name text,
    database_name text,
    process_id integer,
    connection_from text,
    session_id text,
    session_line_num bigint,
    command_tag text,
    session_start_time timestamp with time zone,
    virtual_transaction_id text,
    transaction_id bigint,
    error_severity text,
    sql_state_code text,
    message text,
    detail text,
    hint text,
    internal_query text,
    internal_query_pos integer,
    context text,
    query text,
    query_pos integer,
    location text,
    application_name text,
    backend_type text
    )
    SERVER pglog
    OPTIONS (filename 'pg_log/postgresql.csv', format 'csv');
Create a View
Create view public.alation_postgres_logv as
  SELECT
  session_id,
  user_name,
  session_line_num,
  session_start_time,
  process_id,
  connection_from,
  transaction_id,
  command_tag,
  message,
  log_time,
  sql_state_code,
  error_severity,
  location,
  query,
  database_name,
  application_name
  FROM postgres_log;
Grant access to Alation Service Account:
Grant SELECT on public.alation_postgres_logv to {Alation Service Account}
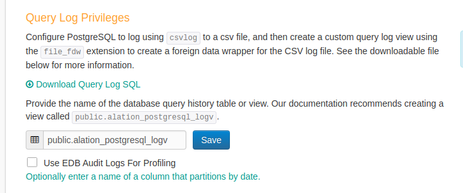
Update General Settings in Alation UI
Enter the view name public.alation_postgres_logv in the Query Log Privileges entry box.
Leave Use EDB Audit Logs for Profiling checkbox unselected.
CSV Logging with Log rotation
A handy way to expose and physically keep around (automatic truncation) only seven days of logs is to define seven child tables for a master one. Process would then look something like this:
set in postgresql.conf + reload conf
log_destination = 'csvlog'

log_filename = 'postgresql-%a'  # Keep 7d of logs in files 'postgresql-Mon.csv' etc.

log_directory ='pg_log'

logging_collector = on

log_min_duration_statement = 0

log_error_verbosity = verbose     # terse, default, or verbose messages

log_hostname = on

log_statement = 'all'    # none, ddl, mod, all

log_truncate_on_rotation = on

log_rotation_age = 1440

log_rotation_size = 0

log_min_error_statement = info
Note
To keep seven days of logs, one log file per day named
postgresql-Mon,postgresql-Tue, etc. and automatically overwrite last week’s log with this week’s log, setlog_filenametopostgresql-%a,log_truncate_on_rotationtoon, andlog_rotation_ageto1440.The difference between setting this option and setting
log_min_duration_statementto zero is that exceedinglog_min_duration_statementforces the text of the query to be logged, butlog_durationdoesn’t.
Install the
file_fdwextension (contribpackage needed) and create a foreign file server and a foreign table, linking to our above configured log file name.
CREATE EXTENSION file_fdw;
CREATE SERVER pglog FOREIGN DATA WRAPPER file_fdw;
CREATE TABLE public.postgres_log (
  log_time timestamp(3) with time zone,
  user_name text,
  database_name text,
  process_id integer,
  connection_from text,
  session_id text,
  session_line_num bigint,
  command_tag text,
  session_start_time timestamp with time zone,
  virtual_transaction_id text,
  transaction_id bigint,
  error_severity text,
  sql_state_code text,
  message text,
  detail text,
  hint text,
  internal_query text,
  internal_query_pos integer,
  context text,
  query text,
  query_pos integer,
  location text,
  application_name text
);
CREATE FOREIGN TABLE public.postgres_log_mon ( log_time timestamp(3) with time zone, user_name text, database_name text, process_id integer, connection_from text, session_id text, session_line_num bigint, command_tag text, session_start_time timestamp with time zone, virtual_transaction_id text, transaction_id bigint, error_severity text, sql_state_code text, message text, detail text, hint text, internal_query text, internal_query_pos integer, context text, query text, query_pos integer, location text, application_name text ) SERVER pglog OPTIONS (filename 'pg_log/postgresql-Mon.csv', format 'csv'); ALTER TABLE public.postgres_log_mon INHERIT public.postgres_log;
Repeat for Tue…Sun
Create a View
Create view public.alation_postgres_logv as
SELECT
  session_id,
  user_name,
  session_line_num,
  session_start_time,
  process_id,
  connection_from,
  transaction_id,
  command_tag,
  message,
  log_time,
  sql_state_code,
  error_severity,
  location,
  query,
  database_name,
  application_name
  FROM postgres_log;
Grant access to Alation Service Account
Grant SELECT on public.alation_postgres_logv to {Alation Service Account}Update General Settings in Alation UI
Have an Alation Admin for your instance configure the General Settings from the Alation UI to point to the created view
public.alation_postgres_logv.Leave Use EDB Audit Logs for Profiling checkbox unselected.
.png)
EDB Audit logs with No Log Rotation
First you need to change the server configuration (postgresql.conf) and enable CSV logging as described in detail here and reload.
# set in postgresql.conf + restart/reload server (changing logging_collector needs restart)
#------------------------------------------------------------
# ERROR REPORTING AND LOGGING
#------------------------------------------------------------

# - Where to Log -

logging_collector = on

#------------------------------------------------------------
# EDB AUDIT
#------------------------------------------------------------

edb_audit = 'csv'                       # none, csv or xml

# These are only used if edb_audit is not none:
edb_audit_directory = 'edb_audit'       # Directory where the log files are written
                                        # Can be absolute or relative to PGDATA

edb_audit_filename = 'postgresaudit'    # Audit file name pattern.
                                        # Can include strftime() escapes

edb_audit_rotation_day = 'none'         # Automatic rotation of log files based
                                        # on day of week. none, every, sun,
                                        # mon, tue, wed, thu, fri, sat

edb_audit_rotation_size = 0             # Automatic rotation of log files will
                                        # happen after this many megabytes (MB)
                                        # of log output.  0 to disable.

edb_audit_rotation_seconds = 0          # Automatic log file rotation will
                                        # happen after this many seconds.

edb_audit_connect = 'all'               # none, failed, all

#edb_audit_disconnect ='none'           # none, all

edb_audit_statement = 'all'             # none, dml, ddl, select, error, rollback, all

#edb_audit_tag = ''
Reload the updated postgressql.conf using the following command:
SELECT pg_reload_conf();Note:
edb_audit_rotation_size = 0,edb_audit_rotation_day = 'none'andedb_audit_rotation_seconds = 0to stop rotation and all logs will be written to the same file, that is, to same table.
Install the
file_fdwextension (contribpackage needed) and create a foreign file server and a foreign table, linking to our above configured log file name.CREATE EXTENSION file_fdw; CREATE SERVER pglog FOREIGN DATA WRAPPER file_fdw; CREATE FOREIGN TABLE public.postgres_log ( log_time timestamp(3) with time zone, user_name text, database_name text, process_id integer, connection_from text, session_id text, session_line_num bigint, command_tag text, session_start_time timestamp with time zone, virtual_transaction_id text, transaction_id bigint, error_severity text, sql_state_code text, message text, detail text, hint text, internal_query text, internal_query_pos integer, context text, query text, query_pos integer, location text, application_name text, extra text ) SERVER pglog OPTIONS ( filename 'edb_audit/postgresaudit.csv', format 'csv');
Create a View
Create view public.alation_postgres_logv as
SELECT
  session_id,
  user_name,
  session_line_num,
  session_start_time,
  process_id,
  connection_from,
  transaction_id,
  command_tag,
  message,
  log_time,
  sql_state_code,
  error_severity,
  location,
  query,
  database_name,
  application_name
FROM postgres_log;
Grant access to Alation Service Account
Grant SELECT on public.alation_postgres_logv to {Alation Service Account}Update General Settings in Alation UI
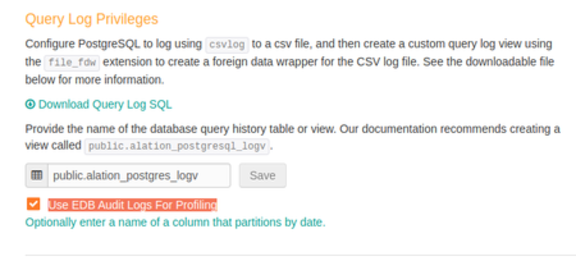
Enter the view
namepublic.alation_postgres_logvin text entry box.Select Use EDB Audit Logs for Profiling checkbox:
Note
This log doesn’t log duration.
EDB Postgres Server with Audit Log Rotation
(Alation version 4.16)
First you need to change the server configuration (postgresql.conf) and enable CSV logging as described in detail here and reload.
# set in postgresql.conf + restart/reload server (changing logging_collector needs restart)
#-----------------------------------------------------------------------------------------
#ERROR REPORTING AND LOGGING
#-----------------------------------------------------------------------------------------
# - Where to Log -
logging_collector = on
#-----------------------------------------------------------------------------------------
# EDB AUDIT
#-----------------------------------------------------------------------------------------
edb_audit = 'csv'                                   # none, csv or xml

# These are only used if edb_audit is not none:

edb_audit_directory = 'edb_audit'                  # Directory where the log files are written
                                                   # Can be absolute or relative to PGDATA

edb_audit_filename = 'audit-%Y-%m-%dT%H:%M:%S'      # Audit file name pattern.
                                                    # Can include strftime() escapes

edb_audit_rotation_day = 'every'                    # Automatic rotation of log files based
                                                    # on day of week. none, every, sun,
                                                    # mon, tue, wed, thu, fri, sat

edb_audit_rotation_size = 0                         # Automatic rotation of log files will
                                                    # happen after this many megabytes (MB)
                                                    # of log output.  0 to disable.

edb_audit_rotation_seconds = 0                      # Automatic log file rotation will
                                                    # happen after this many seconds.

edb_audit_connect = 'all'                           # none, failed, all

#edb_audit_disconnect ='none'                       # none, all

edb_audit_statement = 'all'                         # none, dml, ddl, select, error, rollback, all

#edb_audit_tag = ''                                 # Audit log session tracking tag.
Note:
edb_audit_filename = 'audit-%Y-%m-%dT%H:%M:%S'will create a file with name asaudit-2017-11-26T11:04:44.csv.Every file will be rolled off due to configuration
edb_audit_rotation_day = 'every'
Create a table to copy logs from csv
For EnterpriseDB Postgres Version 9.6:
CREATE TABLE public.postgres_log (
  log_time timestamp(3) with time zone,
  user_name text,
  database_name text,
  process_id integer,
  connection_from text,
  session_id text,
  session_line_num bigint,
  command_tag text,
  session_start_time timestamp with time zone,
  virtual_transaction_id text,
  transaction_id bigint,
  error_severity text,
  sql_state_code text,
  message text,
  detail text,
  hint text,
  internal_query text,
  internal_query_pos integer,
  context text,
  query text,
  query_pos integer,
  location text,
  application_name text,
  extra text
);
For EnterpriseDB Postgres version 10:
CREATE TABLE public.postgres_log (
  log_time timestamp(3) with time zone,
  user_name text,
  database_name text,
  process_id integer,
  connection_from text,
  session_id text,
  session_line_num bigint,
  command_tag text,
  session_start_time timestamp with time zone,
  virtual_transaction_id text,
  transaction_id bigint,
  error_severity text,
  sql_state_code text,
  message text,
  detail text,
  hint text,
  internal_query text,
  internal_query_pos integer,
  context text,
  query text,
  query_pos integer,
  location text,
  application_name text,
  statement_type text,
  extra text
);
Create a log rotation config file as follows. Note:
EDB_AUDIT_LOG_DIRECTORY_PATH should have read privileges.
POSTGRES_HOME/bin/edb-psql should have execute privileges.
vi  postgres_audit_log_rotation_config.txt

EDB_AUDIT_LOG_DIRECTORY_PATH=/opt/edb/as9.6/data/edb_audit/
EDB_AUDIT_LOG_FILENAME_PREFIX=audit-
HOST=10.11.21.41
PORT=5432
USERNAME=postgres
PASSWORD=hyperbad
DATABASE=postgres
POSTGRES_HOME=/opt/edb/as9.6/
Create a log rotation script as follows. Note that following the script will look for yesterday’s log and copy yesterday’s csv to
public.postgres_log.Move both
postgres_audit_log_rotation.shandpostgres_audit_log_rotation_config.txtto {Postgres Installation Directory}/edb/as9.6/bin.mv postgres_audit_log_rotation.sh opt/edb/as9.6/bin/. mv postgres_audit_log_rotation_config.txt opt/edb/as9.6/bin/.
Provide execute permission on
postgres_audit_log_rotation.sh.chmod +x {Postgres Installation Directory}/edb/as9.6/bin/postgres_audit_log_rotation.sh chmod +x opt/edb/as9.6/bin/postgres_audit_log_rotation.sh
Grant read permission on
postgres_audit_log_rotation_config.txtchmod 444 opt/edb/as9.6/bin/postgres_audit_log_rotation_config.txt
Create a cron job to run at 1 am every day script as follows. This will sync yesterday’s log to public.postgres_log at 1.00 AM.
0 1 * * *   sh {Postgres Installation Directory}/edb/as9.6/bin/postres_audit_log_rotation.sh
{Postgres Installation Directory}/edb/as9.6/bin/postres_audit_log_rotation_config.txt
For example, crontab -e
0 1 * * *   sh /opt/edb/as9.6/bin/postres_audit_log_rotation.sh
/opt/edb/as9.6/bin/postres_audit_log_rotation_config.txt
For Ubuntu Users
For example, crontab -e (Use bash instead of sh)
0 1 * * *   bash /opt/edb/as9.6/bin/postres_audit_log_rotation.sh
/opt/edb/as9.6/bin/postres_audit_log_rotation_config.txt
Create a View
Create view public.alation_postgres_logv as
SELECT
  session_id,
  user_name,
  session_line_num,
  session_start_time,
  process_id,
  connection_from,
  transaction_id,
  command_tag,
  message,
  log_time,
  sql_state_code,
  error_severity,
  location,
  query,
  database_name,
  application_name
FROM
  postgres_log;
Grant access to Alation Service Account
Grant SELECT on public.alation_postgres_logv to {Alation Service Account}Update General Settings in Alation UI
Enter the view name
public.alation_postgres_logvin the text entry box.Select the Use EDB Audit Logs for Profiling checkbox:
A.8 Impala QLI Script
from subprocess import call
import os
from datetime import datetime, timedelta, date
import calendar
import sys
import socket


def get_filenames_in_dir(dir_path):
    file_name_list = []
    for (dirpath, dirnames, filenames) in os.walk(dir_path):
        file_name_list.extend(filenames)
        break
    return file_name_list


def grant_full_access_for_dir(dir_path):
    # grant access permission for the tmp file
    cmd = ['sudo', 'chmod', '-R', '777', dir_path]
    print ' '.join(cmd)
    call(cmd)


def copy_file_to_hdfs(file_path, dst_hdfs_path):
    try:
        # overwrite the file in HDFS if it exists already
        cmd = ['hadoop', 'fs', '-copyFromLocal', '-f', file_path, dst_hdfs_path]
        print ' '.join(cmd)
        call(cmd)
    except OSError:
        print 'Cannot run hadoop command in the host. Cmd: ' + ' '.join(cmd)


def copy_logs_to_hdfs(src_log_dir_path, dst_hdfs_dir_path, start_time, end_time):
    # scan audit logs and find the logs created on a specified date
    file_name_list = get_filenames_in_dir(src_log_dir_path)

    # verify the file name, and only process log files
    # example name: impala_audit_event_log_1.0-1464403015360
    prefix = 'impala_audit_event_log'
    version = '1.0'
    prefix_len = len(prefix)
    version_len = len(version)
    timestamp_len = 13
    file_name_len = prefix_len + version_len + timestamp_len + 2
    version_offset = prefix_len + 1
    timestamp_offset = version_offset + version_len + 1

    # the file just before the start_time
    pre_file_time = 0
    pre_file_name = None

    # find all files created inside [start_time, end_time]
    # and the file created just before start_time (because this file should be updated here)
    for file_name in file_name_list:
        # skip the file if the file name length does not match
        if len(file_name) != file_name_len:
            continue

        # skip the file if the file name format does not match
        if file_name[version_offset - 1:version_offset] != '_' or \
                file_name[timestamp_offset - 1:timestamp_offset] != '-' or \
                file_name[0:prefix_len] != prefix:
            continue

        # extract the version of audit log
        current_version = file_name[version_offset:version_offset + version_len]
        if current_version != version:
            print 'Audit log version does not match, file name: ' + current_version
            continue

        # extract time stamp
        timestamp = -1
        try:
            timestamp_str = file_name[timestamp_offset:timestamp_offset + timestamp_len]
            timestamp = long(timestamp_str)
        except ValueError:
            continue

        if timestamp < start_time and pre_file_time < timestamp:
            pre_file_name = file_name
            pre_file_time = timestamp
            continue

        # if the timestamp is outside [start_time, end_time], then skip
        if timestamp < start_time or timestamp >= end_time:
            continue

        # for legal log file names whose timestamp is inside [start_time, end_time]
        file_path = src_log_dir_path + '/' + file_name
        dst_hdfs_path = dst_hdfs_dir_path + '/' + file_name
        copy_file_to_hdfs(file_path, dst_hdfs_path)

    # copy the file created just before the start_time to hdfs
    if pre_file_name is not None:
        file_path = src_log_dir_path + '/' + pre_file_name
        dst_hdfs_path = dst_hdfs_dir_path + '/' + pre_file_name
        copy_file_to_hdfs(file_path, dst_hdfs_path)

if __name__ == "__main__":
    host_id = socket.gethostbyname(socket.gethostname())

    if len(sys.argv) < 3:
        print 'Please specify the source log directory and HDFS log directory. For example,\n' + \
            'python fetch-log source-log-dir hdfs-log-dir\n' + \
            'or\n' + \
            'python fetch-log source-log-dir hdfs-log-dir start-date end-date\n' + \
            'date inputs are in format YYYY-MM-DD'
        sys.exit(0)

    src_log_dir_path = sys.argv[1]
    dst_hdfs_dir_path = sys.argv[2] + '/' + str(host_id)

    today_date = date.today()
    one_day = timedelta(days=1)
    yesterday_date = today_date - one_day

    # by default, the script only fetches log files for folder for yesterday
    start_date = yesterday_date
    end_date = today_date

    try:
        if len(sys.argv) == 5:
            start_date = datetime.strptime(sys.argv[3], "%Y-%m-%d")
            end_date = datetime.strptime(sys.argv[4], "%Y-%m-%d")
    except ValueError:
        print 'Please input the dates in YYYY-MM-DD format.'
        sys.exit(0)

    # start time is the 00:00:00 of the start date in milliseconds
    start_time = calendar.timegm(start_date.timetuple()) * 1000

    # end time is the 00:00:00 of the end date in milliseconds
    end_time = calendar.timegm(end_date.timetuple()) * 1000

    print 'starting from ' + str(start_time) + ' ms'
    print 'ending at ' + str(end_time) + ' ms'

    # create the directory of dst_hdfs_dir_path in hdfs
    try:
        cmd = ['hadoop', 'fs', '-test', '-e', dst_hdfs_dir_path]
        if call(cmd) != 0:
            cmd = ['hadoop', 'fs', '-mkdir', dst_hdfs_dir_path]
            print ' '.join(cmd)
            call(cmd)
    except OSError:
        print 'Cannot run hadoop command in the host. Cmd: ' + ' '.join(cmd)
        sys.exit(0)

    # hadoop user may not have access to audit log, so we grant full access to it.
    # customers may want to modify this according to their security policy.
    grant_full_access_for_dir(src_log_dir_path)

    # put log files in tmp dir to hadoop
    copy_logs_to_hdfs(src_log_dir_path, dst_hdfs_dir_path, start_time, end_time)