Analyze Lineage Charts
Alation Cloud Service Applies to Alation Cloud Service instances of Alation
Customer Managed Applies to customer-managed instances of Alation
When Alation has enough metadata to calculate lineage for a catalog object, such as a table, view, or BI report, the Lineage tab of the object’s catalog page displays a lineage chart.
Note
If there is no lineage data from MDE, QLI, or Compose, the Lineage tab can be used to manually create lineage. Another option is to create and upload lineage information via the Lineage API.
The lineage chart is a visual representation of the data flow between sources and targets. It’s intended to help users trace the origin, transformations, and ultimate usage of data. The lineage chart visually maps out the paths data takes from the initial source, through any intermediate transformations, and finally to the end target, like a BI dashboard or report. Each source or target on the lineage chart is represented as a node, with arrows illustrating the paths between them and dataflows storing the data transformation details.
There are two views of the lineage chart: classic and compound layout.
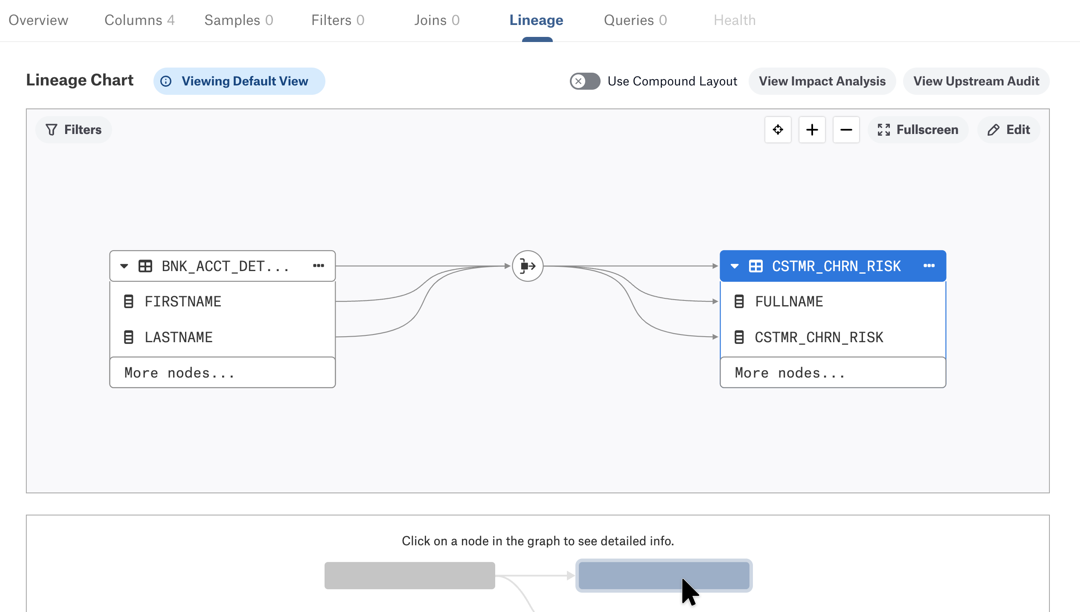
Classic—A linear, sequential display of the data journey, showing the paths from sources to targets through connected nodes and arrows. An example of the classic view is shown below (version 2024.1).
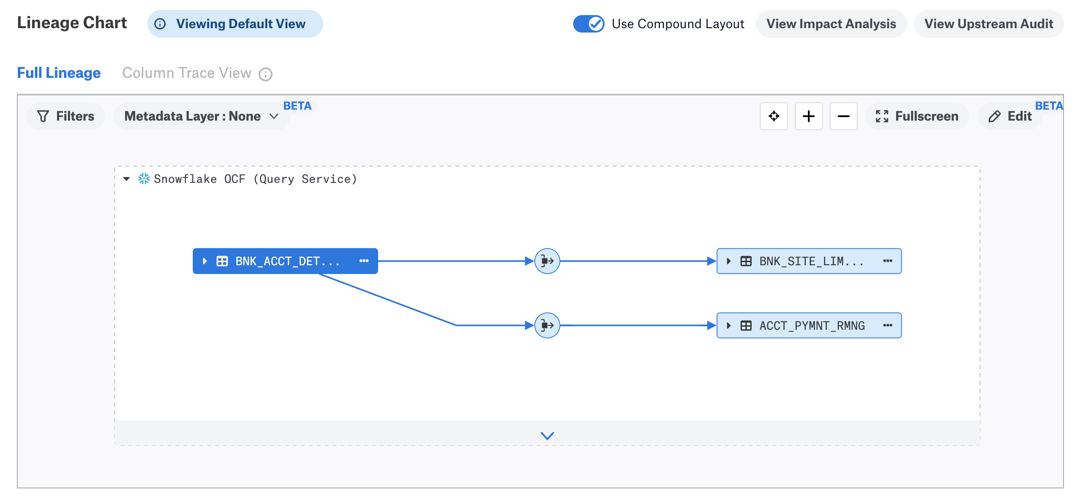
Compound layout—A lineage visualization that groups related nodes by their respective data sources into clusters. This view provides a more focused representation of sources, as they are interconnected with lineage, with the intention to help users navigate complex data relationships with multiple sources and targets and isolate particular areas of interest. The compound layout view:
Is a general availability feature and a recommended view of the lineage chart starting in version 2024.1.
Is a beta feature in versions 2023.1 - 2023.3.5.
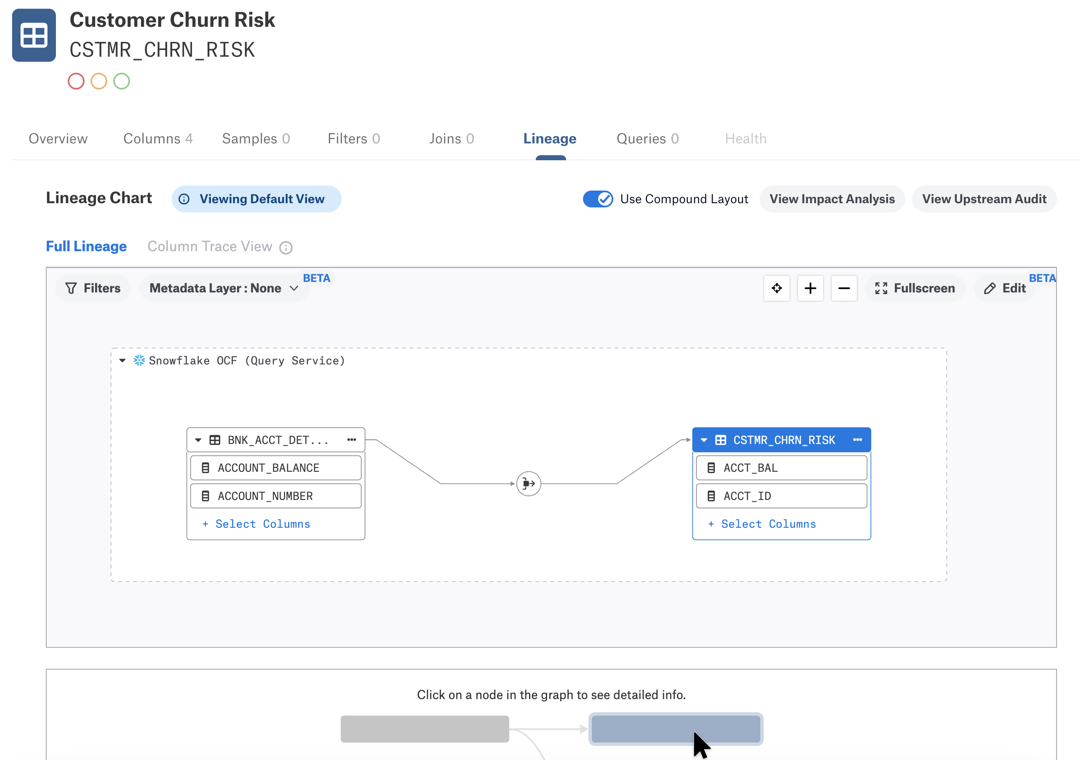
The screenshot below shows the compound layout view (version 2024.1):
Note
If you do not see the Use Compound Layout toggle or the Edit button shown in the screenshots above, your version of Alation may be using an older version of lineage. To update to the latest, see Enabling Lineage V3.
You can explore lineage charts using these capabilities:
Switch Between Lineage Views
When you initially open the Lineage tab for a catalog object, classic is the view you see by default. To activate the compound layout view, click on the Use Compound Layout switch on the right above the lineage chart area. To deactivate it and go back to classic, click the switch again.
Highlight Nodes and Lineage Paths
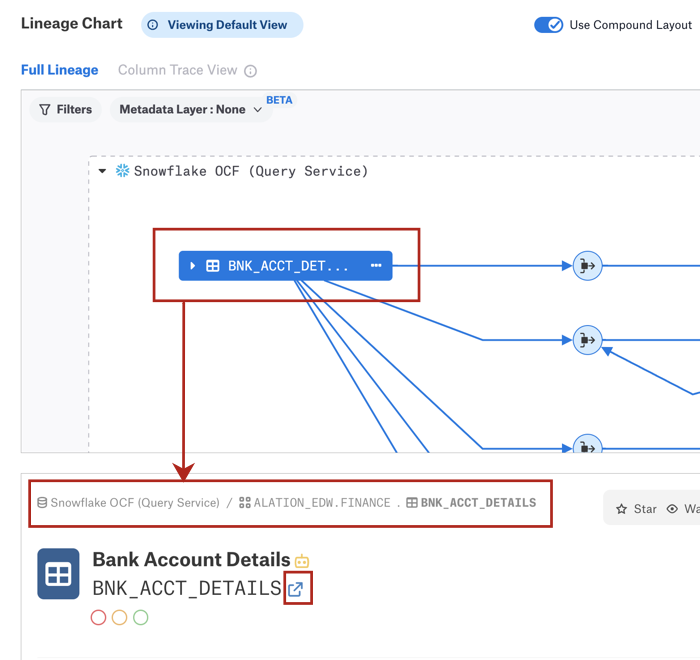
When you initially open the Lineage tab for a catalog object, this main object is highlighted in blue. You can click any node or dataflow object on the chart: this will shift the blue highlighting to the element you click to indicate that it’s selected and currently in the focus. The lineage paths to and from the object will also become highlighted, allowing you to visually trace the data flow.
View Object Details
The Lineage tab has two sections: the lineage chart area (1) and the object preview area under the chart (2).
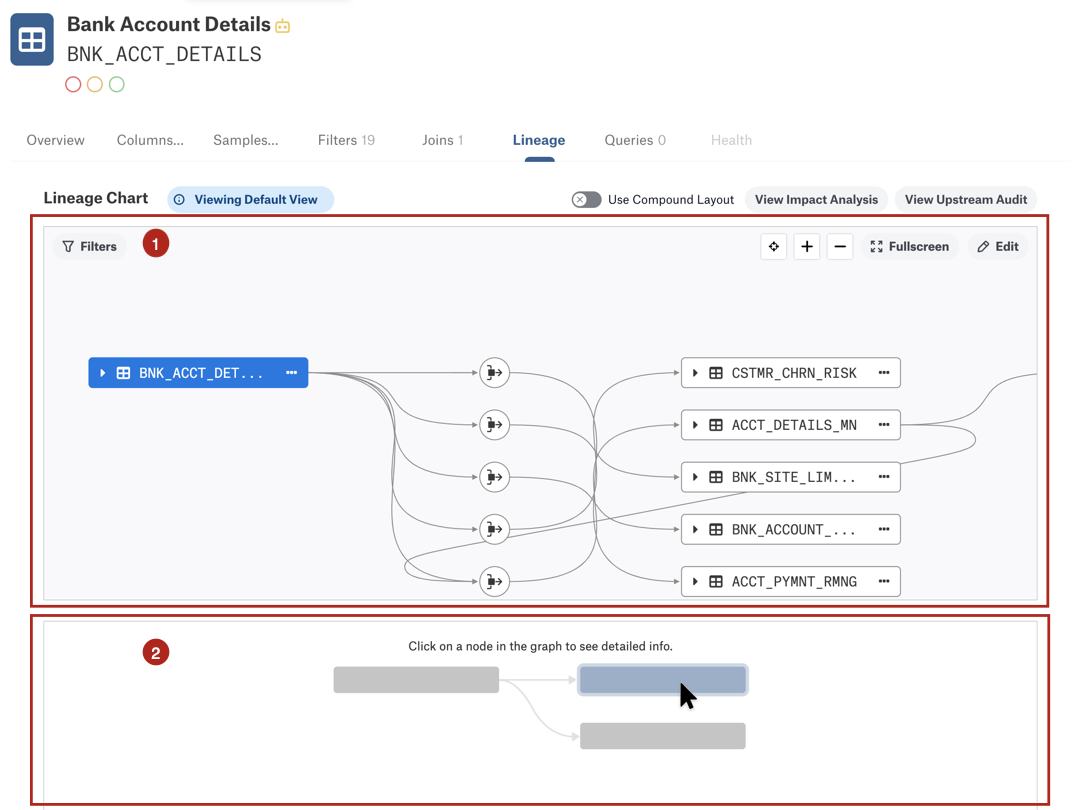
When you select a node on the lineage chart, a preview of the corresponding catalog page loads into the preview area. To go to the that page, click on the arrow next to the object name.
Note
If an object type is not supported by the Alation catalog, the preview pane will tell you that Alation has no data associated with this object. Such objects are assigned the object type external and are marked with the EXT badge. See View Badges for more details.
Interact with the Lineage Chart
You can interact with the lineage chart using a number of view controls and features: zoom in and out of the chart, center the main node, open the full-screen lineage view, and drag the nodes on the chart area.
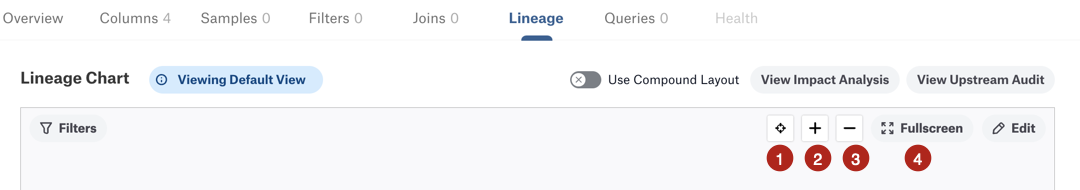
1—Use the Center icon to center the main node on the chart area. The main node is the object that you’re viewing the catalog page for.
2—Use the plus icon to zoom in.
3—Use the minus icon to zoom out.
4—Click the Fullscreen button to open the full-screen mode of the chart. You can close the full-screen view any time by clicking the Close button on the top right of the fullscreen window.
To drag the chart, place the cursor on the chart area, press and hold, and drag the chart around.
The full-screen mode has the same and more view controls as the normal mode. They are located on the top right of the chart area.
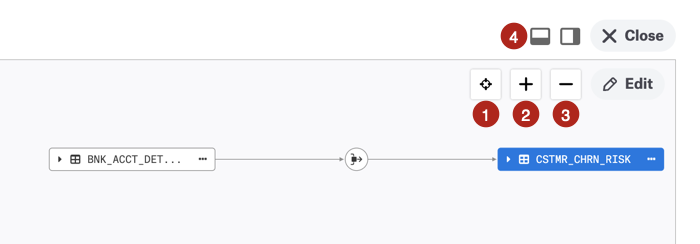
1—Use the Center icon to center the main node on the chart area.
2—Use the plus icon to zoom in.
3—Use the minus icon to zoom out.
4—Use the Dock-to-Bottom and Dock-to-Right buttons to rearrange the chart and preview areas vertically or horizontally.
Resize the chart and preview areas by dragging the divider between them left-right or top-down depending on the orientation.
View Badges
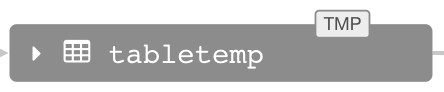
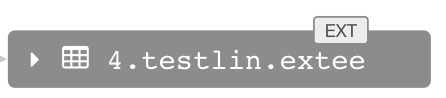
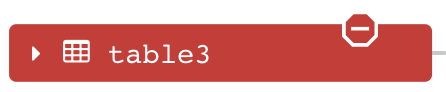
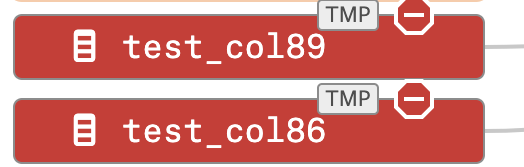
You will sometimes see badges on the lineage nodes. They signal that the data object is temporary, external, or deprecated.
Temporary (TMP)—Objects of this type are supported by the catalog, but this specific object is not present in the Alation catalog metadata. It can be either an object that does not exist in Alation or an object that was deleted. Also see Filter Dataflow Objects below.
External (EXT)—Objects of this type are not currently supported by the Alation Catalog and are represented with a generic object type external. Data with the external object type can be provided using the public API:
Deprecated—An object is flagged as Deprecated in the Alation Catalog:
When multiple badges apply, you will see multiple badges on a single lineage node:
The deprecation badge is shown on the classic lineage chart view automatically when a node is deprecated. On the compound layout view, deprecation information can be optionally displayed as a metadata layer. Find more information in Apply Metadata Layers.
Deprecation Propagation
Deprecation is not only shown as a badge on the flagged object but is also propagated downstream to target objects. The lineage paths that pass deprecation are red too. Although target objects don’t have the deprecation badge, they will also be colored red. You will see that such an object has a propagated warning flag informing you that one of the parent objects is deprecated. The screenshot below shows how deprecation is propagated to downstream lineage.
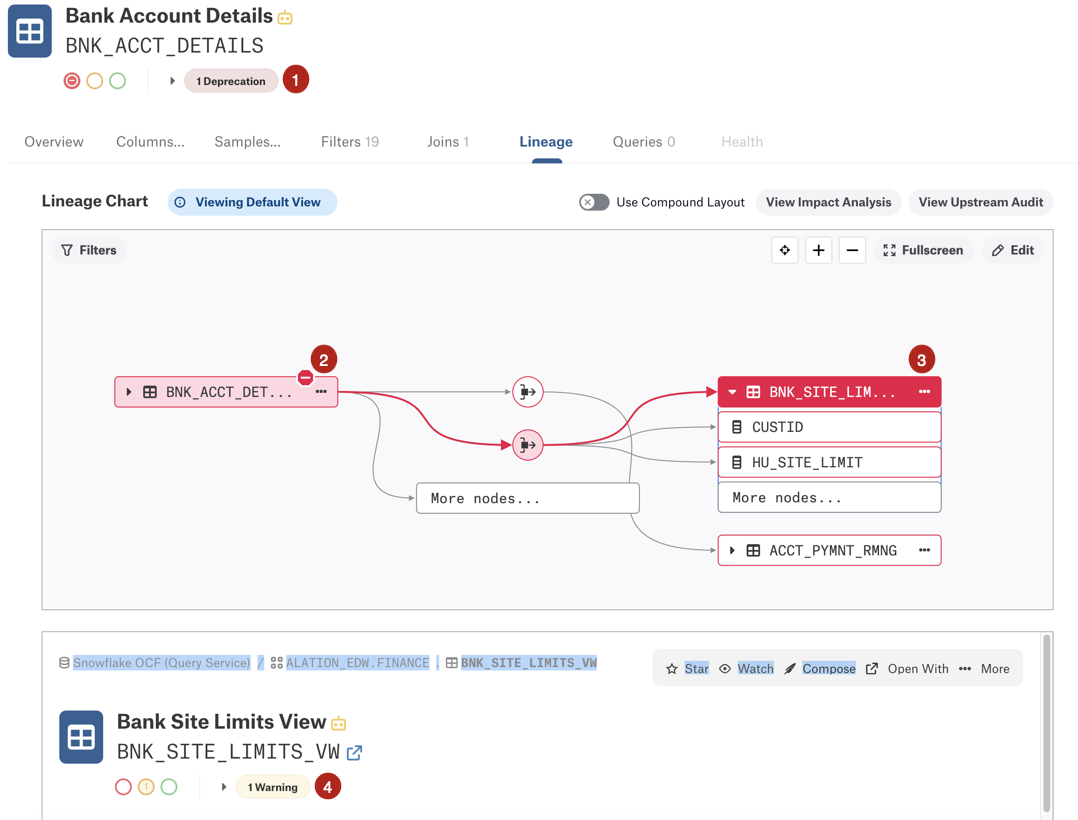
1—The deprecation flag has been added to the
BNK_ACCT_DETAILStable. Note that the Lineage tab is opened on the page of this catalog object.2—The deprecation badge is present on the lineage node of the
BNK_ACCT_DETAILStable. The downstream lineage paths from this object to target objects are highlighted in red, indicating deprecation propagation.3—The target object (the view
BNK_SITE_LIMITS_VW) is selected on the chart and highlighted in red, indicating deprecation propagation. As this object is selected, the preview area under the chart displays the preview of this object.4—The warning flag on the catalog page of the target object (the view
BNK_SITE_LIMITS_VW) that is the result of the deprecation propagation from the source object (theBNK_ACCT_DETAILStable).
Deprecation propagation applies to the compound layout view as well, where it will affect all objects downstream from the deprecated object in a similar fashion. However, warnings propagated from deprecation can be displayed as a separate metadata layer. Learn more in Apply Metadata Layers (Beta).
Load More Nodes on Demand
Classic View
Extremely large lineage charts can be difficult to process and display. Starting in version 2022.4, an admin can control both the horizontal and vertical extent of such charts. If you are an Alation Server Admin, see Configure Lineage Charts about how to set the number of nodes.
Note
Earlier releases using Lineage V2 provided control over just the vertical extent. Refer to Modify the Number of Nodes Collapsed in Lineage V2 Charts for more information.
Horizontal Pagination
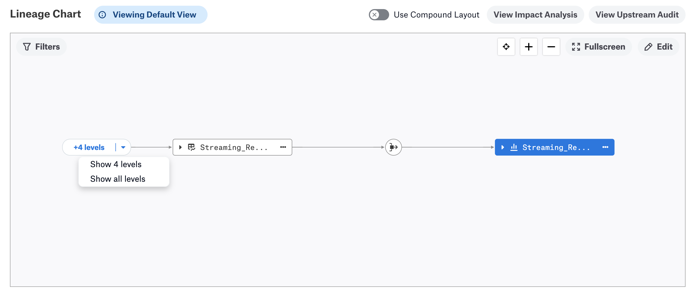
Horizontal pagination allows Server Admins to specify the number of nodes displayed by default before a user has to click to see more. If your Server Admin limited the number of nodes, larger diagrams may display horizontal pagination nodes that can be expanded to show more lineage.
In the classic view, you will see the +# levels node that hides additional lineages. You can click to show either four more levels or all levels.
Vertically Collapsed Nodes
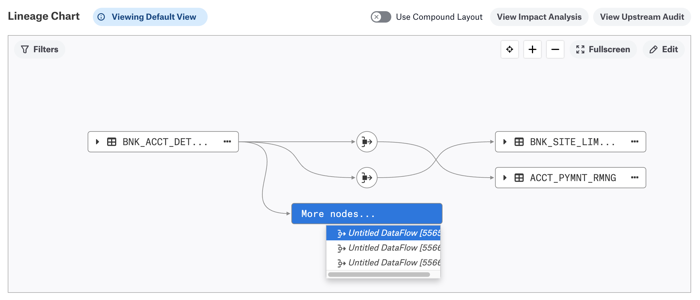
On large multi-node lineage diagrams, some of the same-level nodes will be collapsed under a node named More nodes. You can add the hidden nodes one by one.
To add the hidden nodes to the chart:
Click More nodes to open the list of hidden objects.
Click the node you want to add. It will be added to the chart and removed from under the More nodes node. This way, you can add all the collapsed nodes one by one to be displayed on the chart.
Compound View
In the compound layout view, you can use the node collection filter to define which nodes to display (requires the alation_conf flag alation.feature_flags.DEV_enable_lineage_collection_nodes_modal to be in True. Learn more about alation_conf in Using alation_conf.)
Note
Alation Cloud Service customers can request feature flag changes through Alation Support.
View Column-Level Lineage
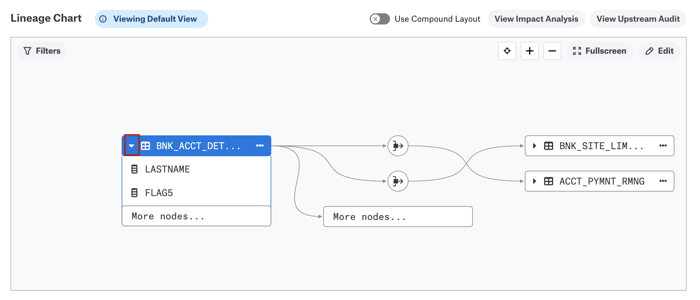
You can view column-level lineage by expanding the parent table node to see the child columns and the associated lineage. To expand, click the arrow icon on the lineage node:
Note
If there are multiple child nodes, some may be further collapsed under another node More nodes.
To collapse the parent and hide the column child objects, click the arrow icon again.
In the compound layout view, you can also trace column-level lineage for individual columns. See Trace Column Lineage below.
Trace Column Lineage
In the compound layout, you trace column-level lineage for each column:
Expand a lineage node by clicking the arrow icon on the data object. A list of the columns appears.
Hover over a column name and a Trace Lineage button will appear beside the column name.
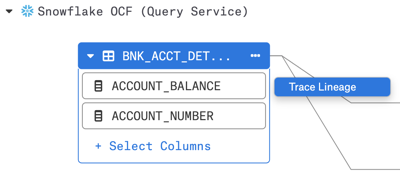
Click the Trace Lineage button. When the lineage trace is ready, a message appears with a View button:

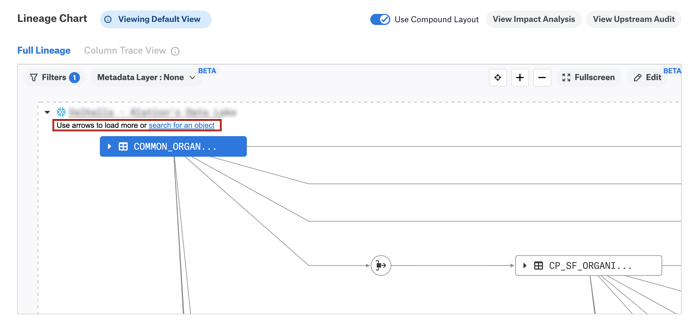
Click View to enter the Column Trace View, which shows the lineage for the selected column.
You can move between this Column Trace View and the Full Lineage view by clicking their respective labels at the top of the lineage chart.
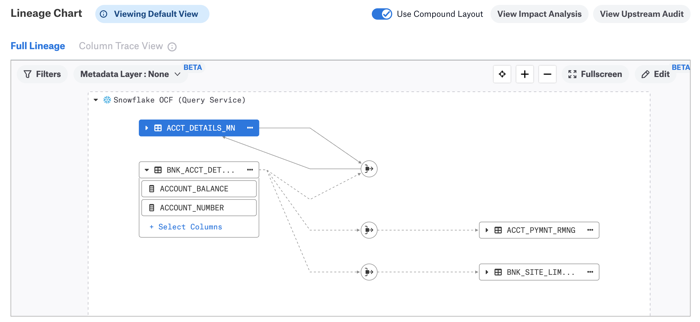
View Source and Target Objects
In both the classic and compound layout views, the lineage chart can display additional upstream and downstream lineages that are not directly linked to the main object. For example, if a node has links to more than one source or target tables, this lineage data can be revealed additionally.
You may notice that each data node on the lineage chart has three dots displayed on the right of the node. To explore additional lineage links for the nodes on the chart, click the three dots on the node and in the list that opens, click either Show parents or Show children:
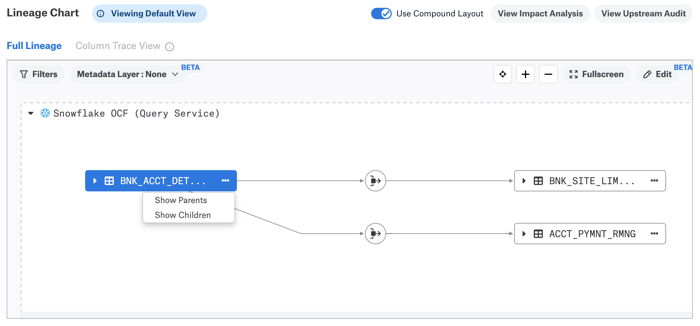
Show parents—Reveals all upstream lineage for an object (source objects)
Show children—Reveals all downstream lineage (target objects)
The additional source or target objects that are not directly linked to the main object—the object on the page from which you opened the Lineage chart—will be connected using dotted lines:
Filter Dataflow Objects
Available from release 2022.3
It is possible to exclude groups of lineage paths using the Filters button in the lineage chart. You can filter using dataflow sources, which are groups you define and manage, as well as show or hide temp objects.
If you have defined one or more dataflow sources, they will appear under Dataflow Source in the Filter Lineage to: dialog. To select all the sources, click Select all. Otherwise, select one or more of the defined sources.
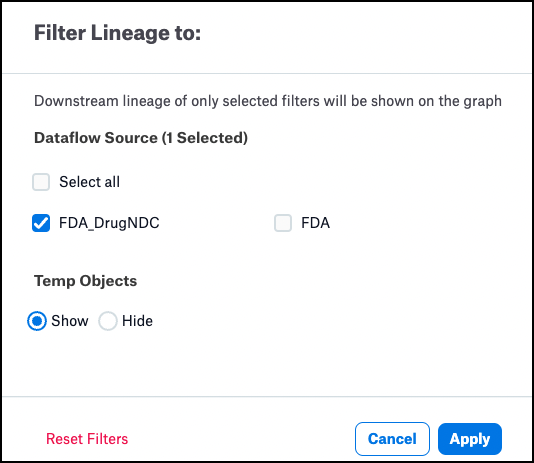
Click Apply to apply the filter. The lineage chart will be redrawn to show those paths that, if they have a dataflow source defined, match the selected sources. Paths for which no source is defined are also shown.
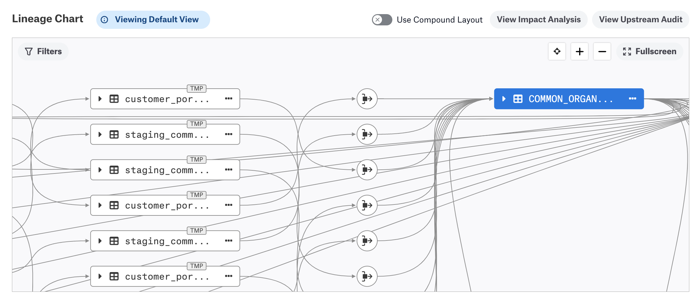
Similarly, if you choose the Hide button under Temp Objects, the lineage chart will be re-drawn without temporary objects. For example, here is a Lineage diagram with several temporary objects:
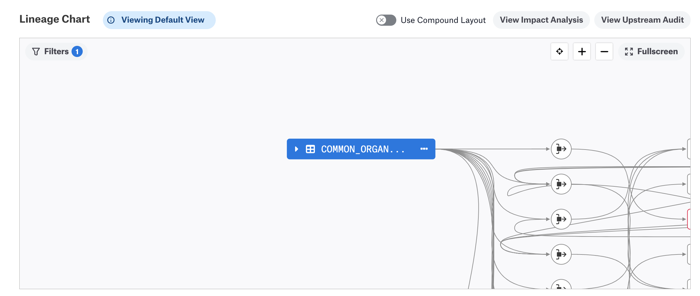
After applying the Hide button:
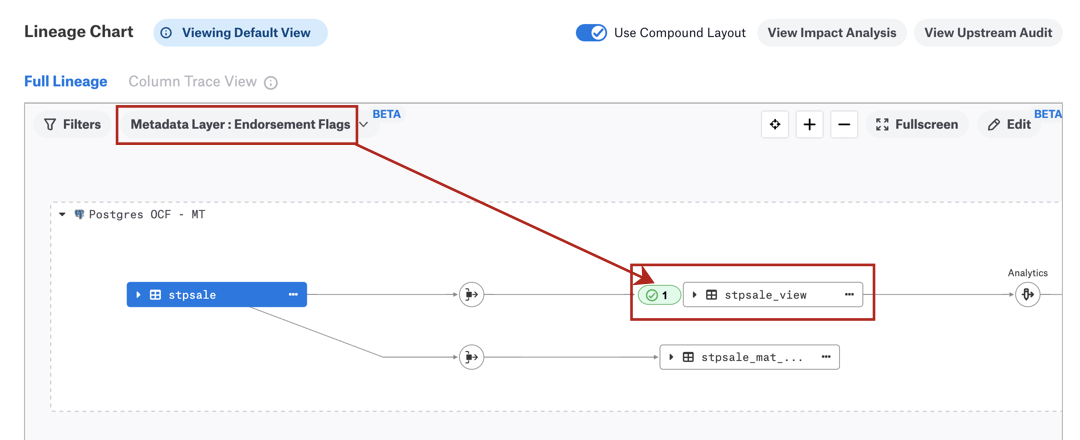
Apply Metadata Layers (Beta)
Applies from version 2024.1
In the compound layout view, the depreciation badge won’t appear by default. Instead, you have the ability to apply the trust flags information to the chart as an additional metadata layer.
To apply a metadata layer:
Locate the Metadata Layer list on the top left of the lineage chart in the compound layout view. By default, no metadata layers are selected.
Click the down arrow to open the list of available metadata layers.
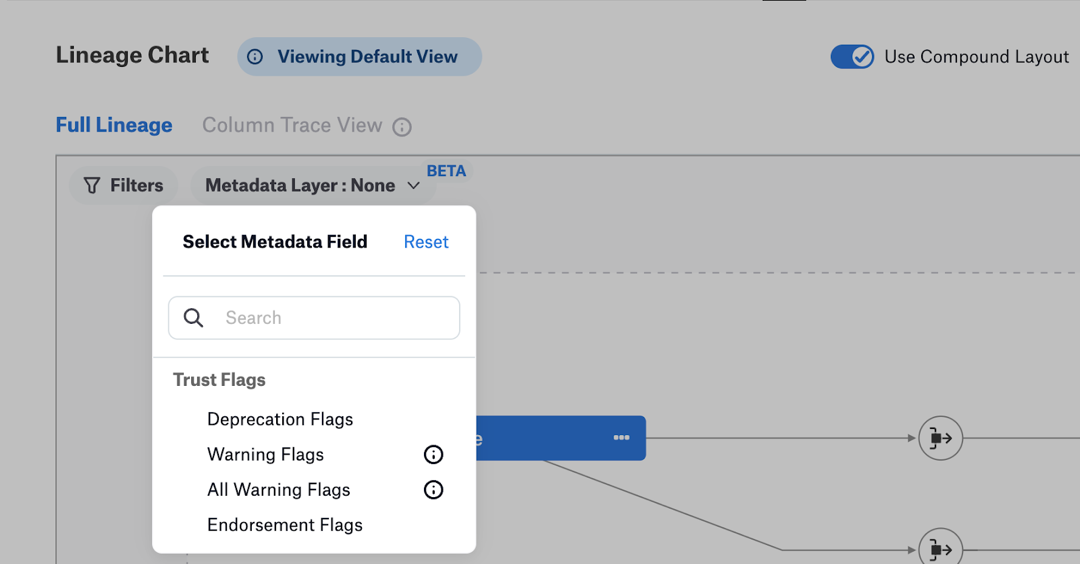
Select a layer to display. You can display one layer at a time.
Deprecation Flags—Display the deprecation flags. Deprecation is propagated from source objects to target objects and from parent objects to child objects.
Warning Flags—Display the warning flags added directly to the object. This option doesn’t display the warnings that are propagated from deprecation flags on source or parent objects.
All Warning Flags—Display all he warning flags, including propagated warnings.
Endorsement Flags—Display the endorsement flags.
When you select a layer, it is applied to the chart.
To remove a metadata layer from the chart, open the Metadata Layer list and click the Reset link in the top right corner.
View Metadata Layer Summary
When you display a metadata layer for a trust flag, you will see the corresponding badge next to the lineage node it is applied to. You can view more information about the badge and the node in a metadata summary pop-up.
To view the summary:
On the compound layout view, click on the trust flag badge. The summary pop-up will appear, displaying the following information:
Description
Stewards
Upstream and downstream connections
Last updated
The trust flag details
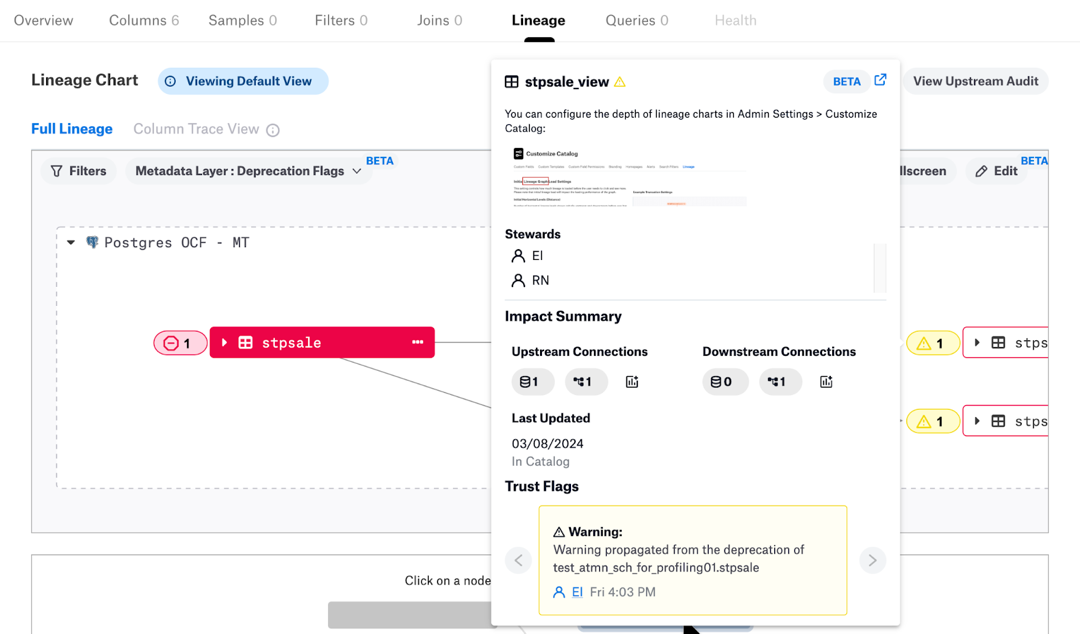
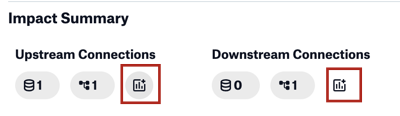
You can further explore the upstream or downstream impact of the lineage node by viewing the corresponding tabular lineage reports. To view the reports, click the report icon under Upstream Connections or Downstream Connections.
Display Name or Title (Beta)
Applies from version 2024.1.1
On the compound layout view, you can choose to display either the technical name or the title of an object:
Title is the value of the Title field on the catalog page of an object. This is an editable name given to the object by users who curate catalog pages, which can also be modified via API.
Technical name is the name of a catalog object that originates in the metadata extracted from the source. Technical names cannot be edited by catalog users.
By default, technical names are used as labels on lineage nodes.
To switch between the name or the title:
Navigate to the catalog page of an object and open the Lineage tab.
Click Use Compound Layout to switch to the compound layout view.
In the top left corner of the chart area, click Filters to open the Filter Lineage dialog.
Under Display Name or Title, choose:
Name to use technical names.
Business Title to use catalog titles.
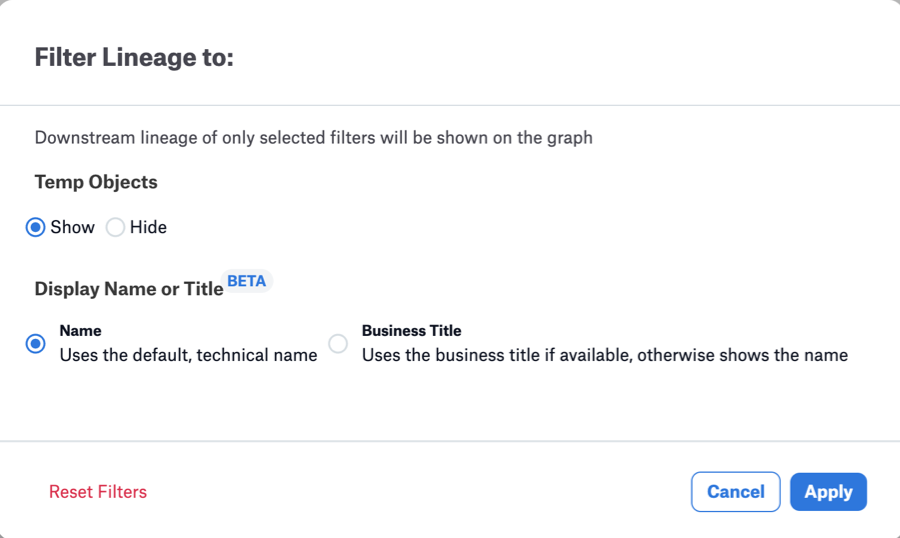
Click Apply to update the node labels in the lineage chart. If an object doesn’t have a title, its technical name will be displayed.
Note
The label change applies to the current user and only affects the current view of the chart. Navigating away from the object’s catalog page or refreshing the page will revert the display to the default view.
Use Tabular Lineage Reports
Applies from release 2021.1
You can view the downstream or upstream lineage of an object in a tabular format. See Leverage Lineage Impact Analysis.