Report Catalog Page
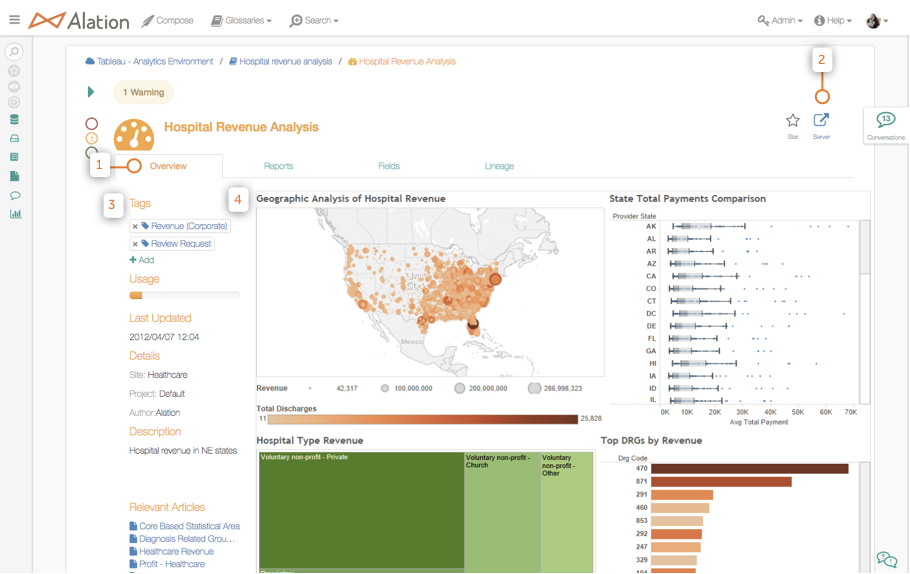
When you open a Report Catalog page, you will automatically open the Overview tab.
If your viz comes from Tableau, click the Server button to open the viz on the Tableau Server.
Basic information and metadata about your report.
A static image of your report.
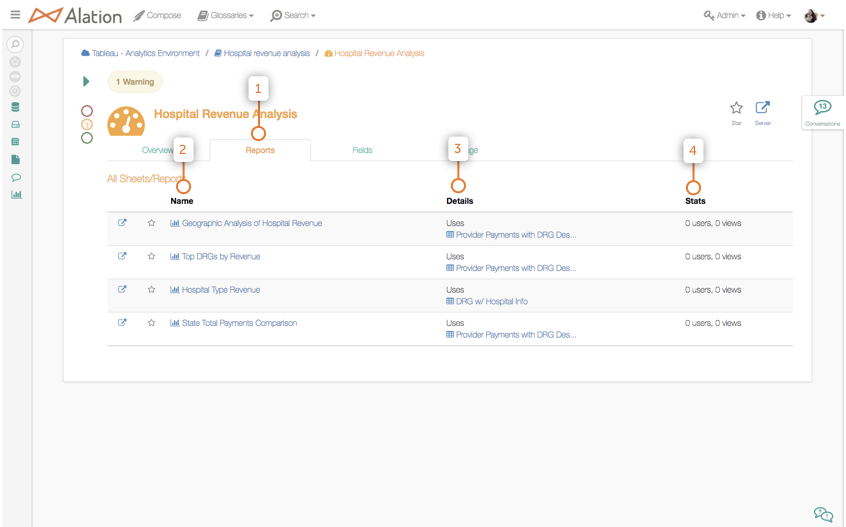
Click the Sheets tab to learn about the Worksheets that make up your Dashboard. This tab will be empty if there is a Worksheet on the Overview tab.
The name of each Worksheet in your Dashboard. Click the name of the Worksheet to open its Catalog page in Alation.
The Details field lists each Worksheet’s source table(s).
Stats provides the number of users that have viewed your report on Tableau Server and the number of total times it is viewed.
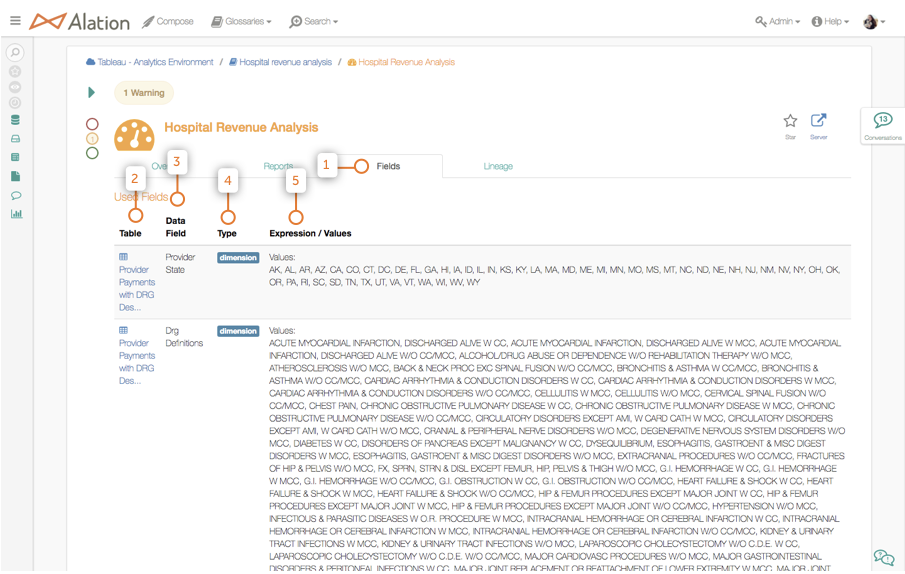
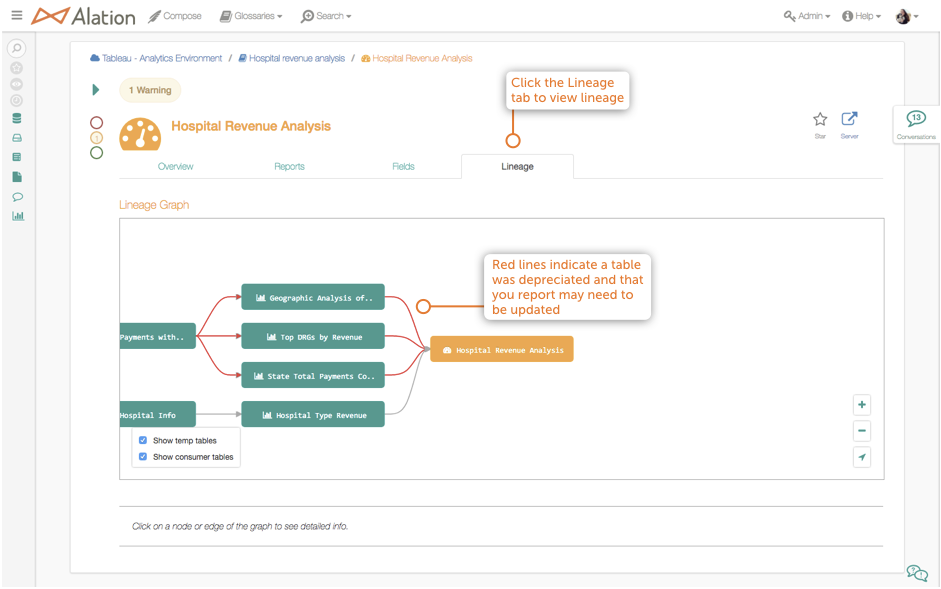
Click the Fields tab to learn about the column-level information that makes up your report.
The Table field lists the name of the source table where your data comes from. Click the name of the table to open its Catalog page in Alation.
The Data Field lists the source column name from the table.
Type indicates what kind of raw data is in the column.
Expression/Values provides sample data from the column.